Sometimes in math, it helps to have a picture. When problems feel tricky, like splitting things fairly, comparing numbers, or figuring out what’s missing, a clear visual can make it easier to understand.
One great way to “see” the math is by using a bar model.
In this guide, we’ll show you what bar models are, go over the different types, and explore how they can help you solve math problems, from simple addition to multiplication and fractions.
You’ll also get a chance to test what you’ve learned with a short quiz, and we’ll answer some common questions students and parents often ask.
What Is a Bar Model?
A bar model, also called a bar diagram, is a simple drawing that uses bars to show numbers and how they relate to each other. Each bar is drawn to match the size of the number it represents, so bigger numbers have longer bars and smaller numbers have shorter bars.
Bar models help us see how numbers are connected, whether they’re combining parts to make a whole, comparing two amounts, or solving for an unknown value.
Let’s see how this looks with an example.
Say Zoe has 3 donuts and Ethan has 5.
We can draw one bar for each, put them together, and see the total like so:
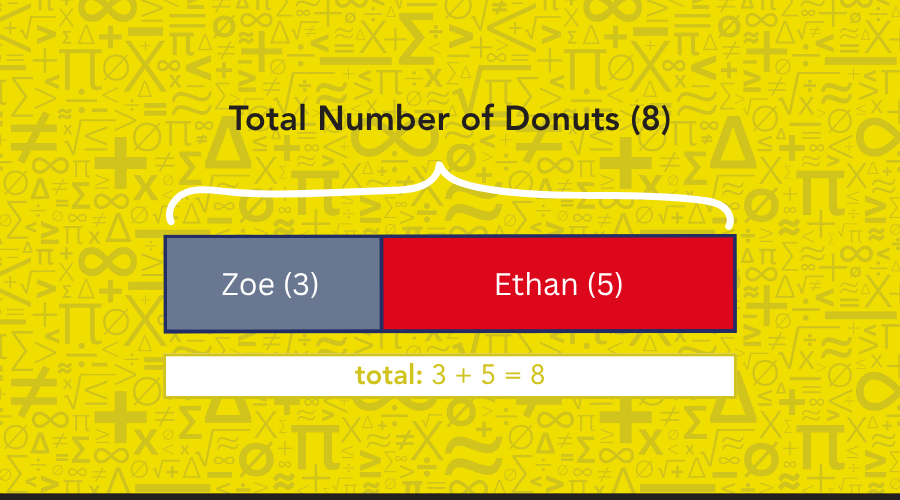
Together, they have 3 + 5 = 8 donuts.
Even in a simple problem like this, a bar model shows how visual tools can support clear thinking.
You May Also Like: What Do Brackets Mean in Math?
Types of Bar Models
Based on the kind of math problem we’re solving, the types of bar models we can use include:
-
Part–Whole Bar Model
-
Equal Parts of a Whole Model
-
Comparison Model
Let’s take a closer look at what each one means.
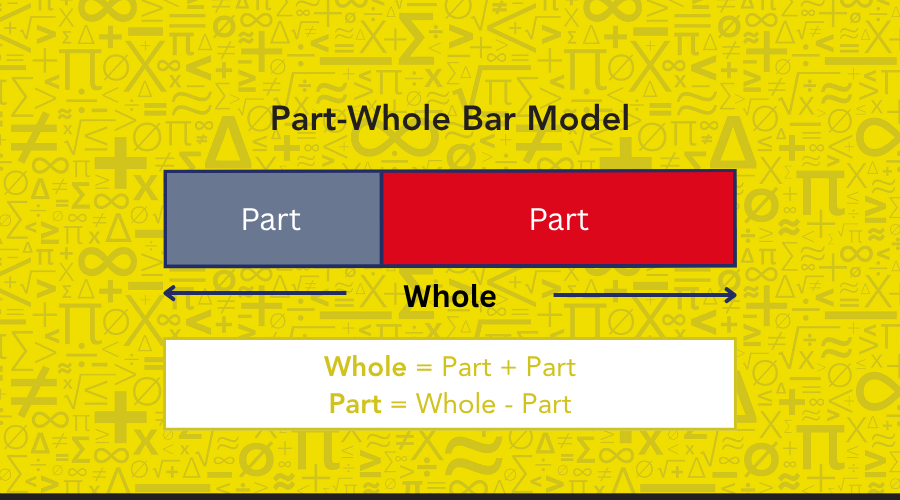
1. Part-Whole Bar Model
A part-whole bar model shows how two or more parts come together to make a whole. Each part is represented by a bar, and the total is shown by a longer bar that includes them all.
This model is great for addition and subtraction because it helps us see how parts fit together to form a total or how a total can be split to find a missing part.
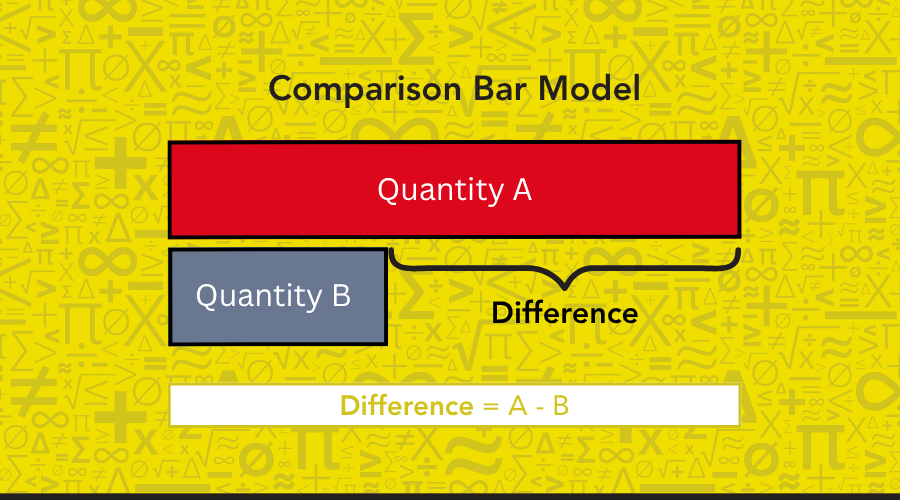
2. Comparison Bar Model
A comparison bar model shows the difference between two amounts. Each amount is represented by a bar, and the extra length in one bar shows how much more (or less) it is than the other.
This model works well for subtraction and “how many more” or “how many fewer” questions, because it helps us see the gap between two values instead of just calculating it.
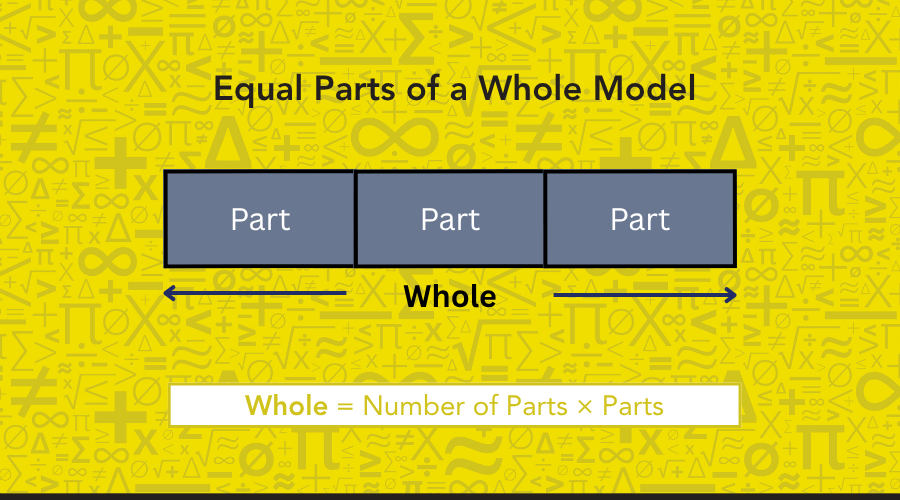
3. Equal Parts of a Whole Model
Equal parts of a whole model shows the same amount repeated over and over. Each part is drawn as a bar of equal length, and together they show the total.
This model is perfect for multiplication, division, and fractions, because it helps students picture equal groups or divide a whole into equal parts.
How Do We Use a Bar Model in Math?
At Mathnasium, we often say that math is easier to understand when you can see it. That’s exactly what bar models help us do – they turn numbers and questions into something visual and clear.
Whether we are adding, subtracting, multiplying, dividing, or comparing values, bar models give us a way to organize our thinking and make sense of what’s happening in the problem.
Let’s look at a few word problems to see how this works in action.
Using a Bar Model for Addition
Ellie has 8 old markers, and she buys 2 more at the store. How many markers does she have now?
Here, we know both parts: the 8 she had with and the 2 she bought. What we don’t know yet is the whole, or total.
We can use a part–whole bar model to make this easier to see.
We draw two bars: one for 8 and one for 2. When we put them together, we can clearly see how they form the total.
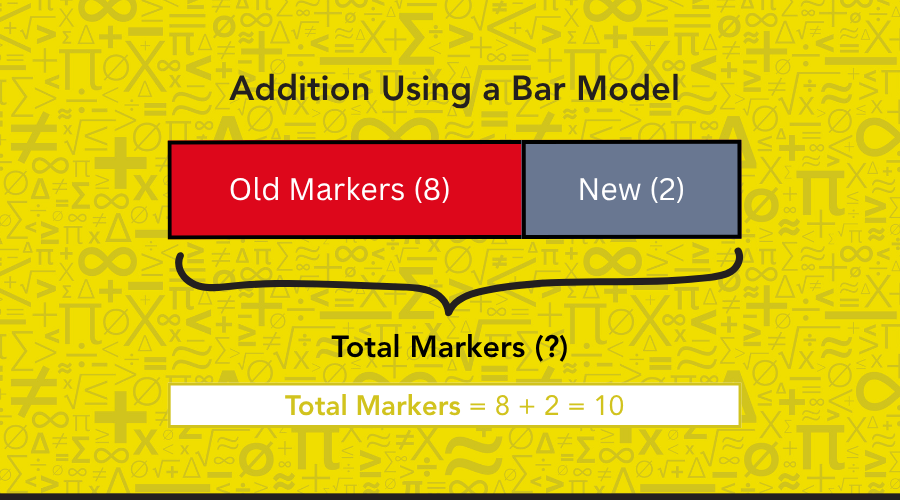
8 + 2 = 10 markers
With a bar model, we don’t just add numbers; we understand how the parts come together to make a whole.
Pretty neat, right?
Using a Bar Model for Subtraction
Mason had 10 balloons at the start of the party. By the end, 3 had popped. How many balloons does he have left?
In this problem, we know the whole (10 balloons) and one part (3 that popped). What we’re looking for is the missing part: how many are left.
This is an ideal chance to use a part–whole bar model.
We draw a long bar to represent the total, then mark off 3 for the popped balloons. What remains in the bar shows us the answer:
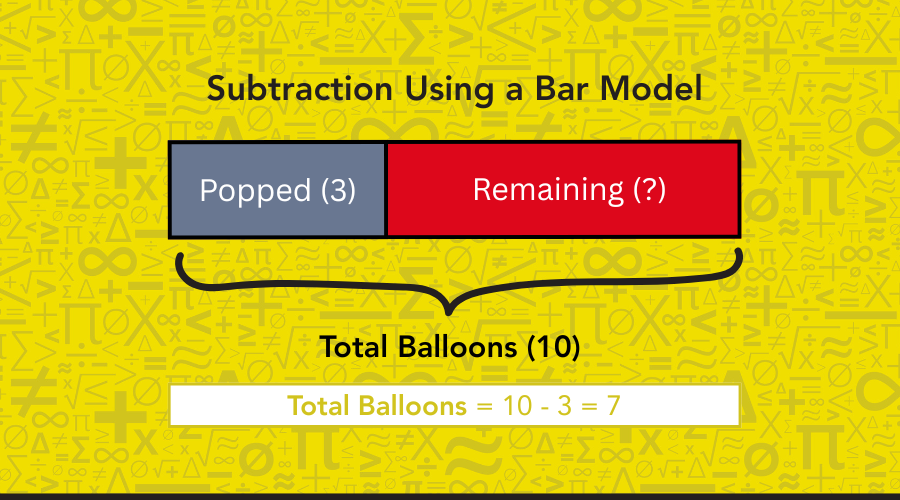
10 – 3 = 7 balloons
A bar model helps us see what's being taken away and understand the relationship between the total and the parts.
Using a Bar Model for Multiplication
Noah has 4 toy boxes, and each box holds 5 toys. How many toys does Noah have in total?
In this case, we know that the same amount, 5 toys, is being repeated 4 times. That’s exactly what multiplication is: equal groups added together.
We can use equal parts of a whole model to show this.
We draw 4 equal bars, each labeled with the number 5. Then, we combine them to find the total.
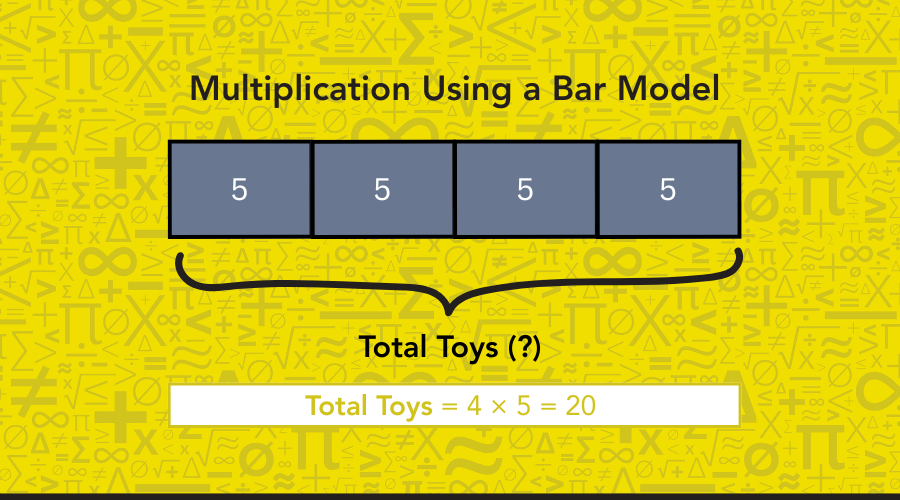
5 + 5 + 5 + 5 = 20
or
4 × 5 = 20 toys
Using a Bar Model for Division
Sophia has 12 stickers, and she wants to share them equally with 3 friends. How many stickers will each friend get?
Here, we know the total (12 stickers) and the number of groups (3 friends). What we’re trying to find is the size of each group.
We can use equal parts of a whole model to show this as well.
We draw one long bar for the total (12), then divide it into 3 equal parts—one for each friend.
Bar models like this help us see multiplication as more than just a shortcut; we see it as repeated addition, and the model shows exactly how those groups fit together.
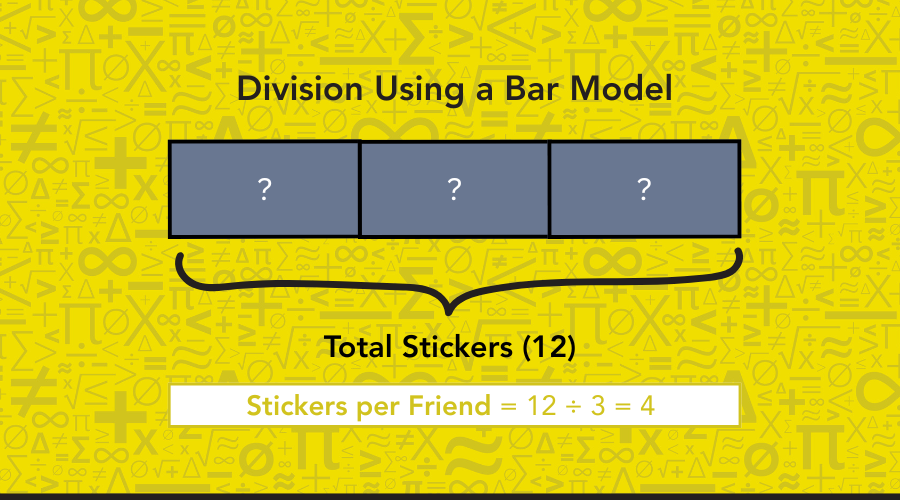
12 ÷ 3 = 4 stickers
Each part of the bar shows the number of stickers each friend will get.
Using a Bar Model for Comparison
Jackson has 7 pencils, and Mia has 4. How many more pencils does Jackson have?
In this problem, we’re comparing two amounts to find the difference or how much more one person has than the other.
We can use a comparison bar model to make that difference easy to see.
We draw two bars: one for Jackson (7) and a shorter one for Mia (4). The part that “sticks out” from Jackson’s bar shows the extra amount.
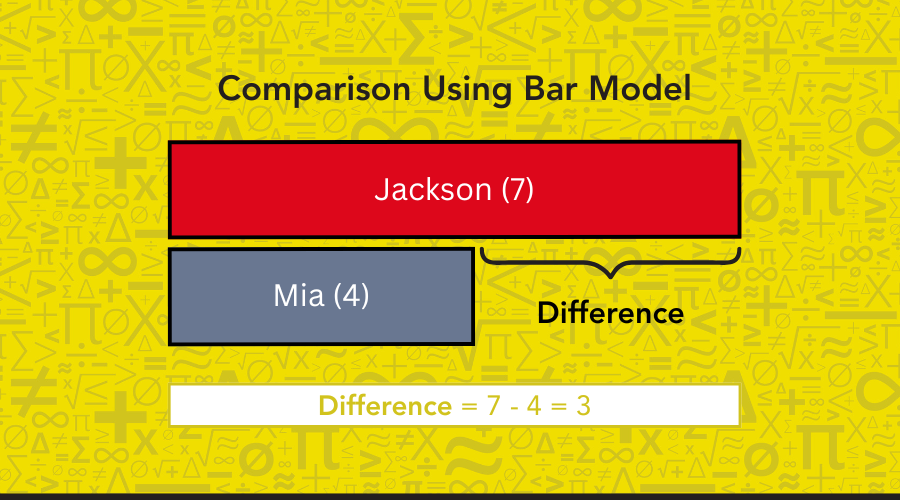
7 – 4 = 3 pencils
A comparison bar model helps us focus on the gap between two values.
Understanding Fractions with Bar Models
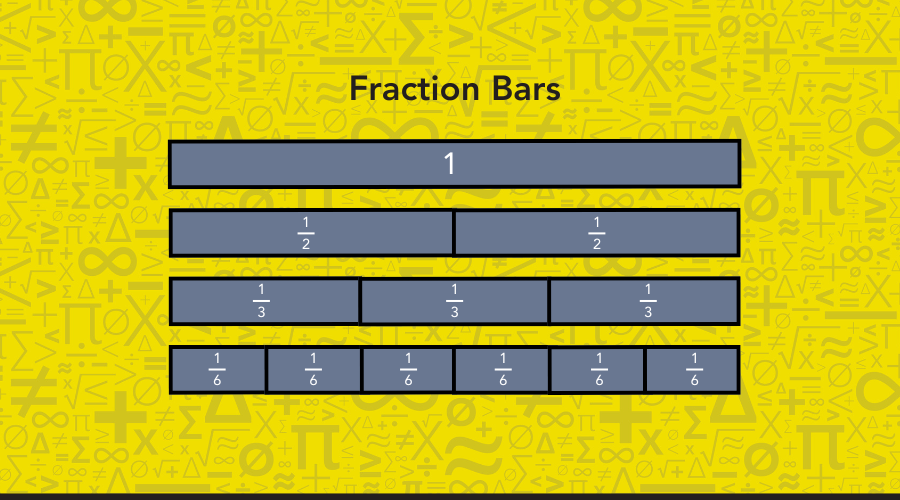
When students first begin learning about fractions, they often struggle with the idea that a number can represent part of something, not just a whole amount. It can feel abstract and unfamiliar.
That’s where bar models make a big difference.
Bar models give students a clear way to see fractions as equal parts of a whole. By dividing a single bar into sections of equal length, students can visualize what it means to have one half, three fourths, or two thirds, and how those parts relate to the whole and to each other.
Instead of memorizing rules, students begin to understand:
-
How many parts the whole is divided into (the denominator)
-
How many parts are being considered (the numerator)
-
How to compare, combine, or subtract fractions by looking at the bar
At Mathnasium, we use bar models to take the mystery out of fractions and help students build real understanding, one visual step at a time.
Flash Quiz: How Do We Use a Bar Model in Math?
Ready to practice what you’ve learned about bar models? Try these quick exercises to see how well you can “see” the math.
Each question uses a visual, so look closely and think about what the bar is showing.
When you’re done, check your answers at the bottom of the guide.
1) What fraction is the shaded part of this fraction bar?
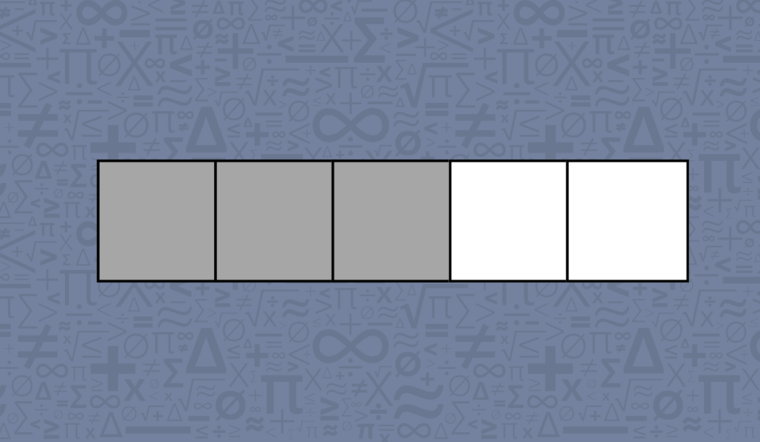
a) \(\displaystyle \frac{3}{2}\)
b) \(\displaystyle \frac{3}{5}\)
c) \(\displaystyle \frac{2}{5}\)
d) \(\displaystyle \frac{5}{3}\)
2) What type of bar model is shown below?
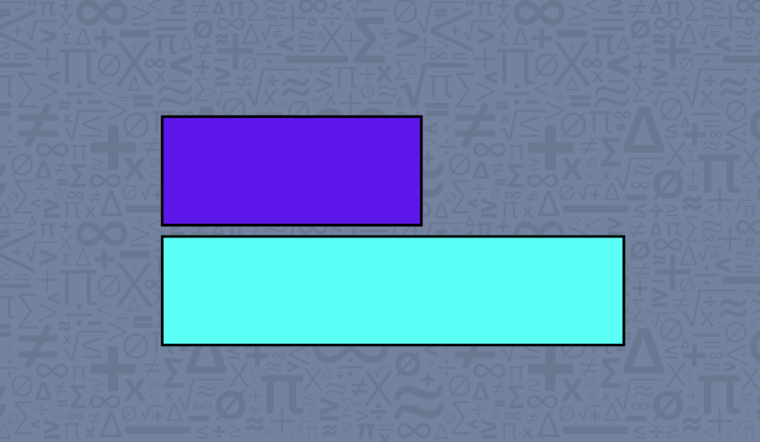
a) Part–whole bar model
b) Equal parts of a whole model
c) Comparison bar model
d) Fraction bar model
3) Which equation matches this bar model?
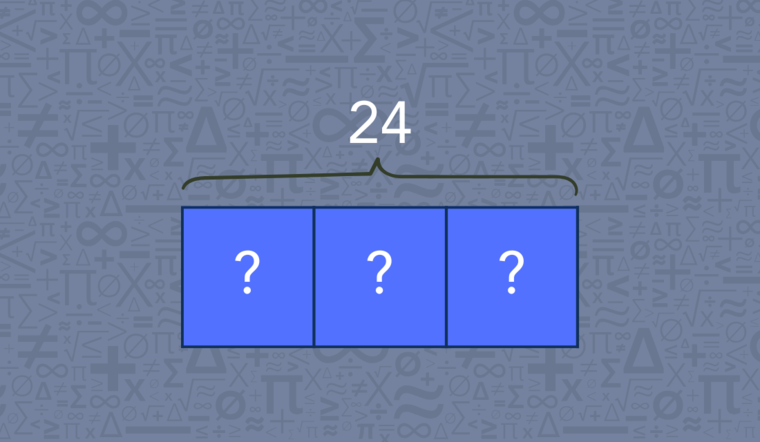
a) 3 x 24 = ___
b) 24 + 3 = ___
c) 24 - 3 = ___
d) 24 ÷ 3 = ___
4) What is the value of the missing number in this bar model?
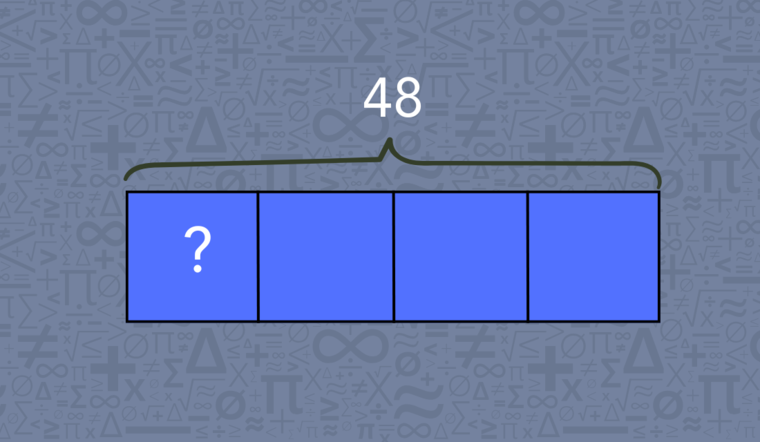
a) 12
b) 24
c) 7
d) 9
FAQs about Bar Models in Math
When learning about bar models, students often run into a few dilemmas. Here are some of the questions we commonly hear at Mathnasium of Castle Hills, along with answers to clear things up.
1) When do students usually learn about bar models in school?
Bar models are often introduced in grades 2 through 4, especially when students begin working with word problems and early fractions. As math problems become more complex, students continue using bar models to organize information and solve problems step by step.
2) Are bar models only used for word problems?
Not at all. While they’re great for solving word problems, bar models also help students understand core math concepts like part–whole relationships, multiplication, division, and fractions, even before there's any text involved. They’re about visualizing how numbers work together.
3) Do advanced students still benefit from using bar models?
Yes. Bar models aren’t just for beginners—they’re a valuable tool for any level of learner. Advanced students often use them to break down multi-step problems or to justify their reasoning visually, especially when working with ratios, equations, or algebraic thinking.
4) Should students keep using bar models once they know how to solve problems mentally?
Yes, especially when the math becomes more layered. Bar models aren’t a crutch, they’re a strategy. At Mathnasium, we teach students to use them as a way to clarify their thinking, not just to find answers. Visual models build deeper understanding that supports long-term success.
Master Bar Models at Mathnasium of Castle Hills
Mathnasium of Castle Hills is a math-only learning center dedicated to helping K-12 students of all skill levels in and near Carrollton, TX, excel in math.
Using a proprietary teaching approach called the Mathnasium Method™, our specially trained math tutors provide personalized math instruction in an engaging group environment to help students learn and master any math class and topic, including bar models, typically covered in both elementary and middle school math.
Each student begins their Mathnasium journey with a diagnostic assessment, so we can identify their current skill level, strengths, and knowledge gaps. Based on these insights, we build a personalized learning plan that puts them on the best path towards reaching their academic goals.
Whether your student is looking to catch up, keep up, or get ahead in their math class, Mathnasium of Castle Hills is here to help.
Ready to take the first step?
Schedule a Free Assessment at Mathnasium of Castle Hills
Pssst! Check Your Answers Here
If you’ve given our flash quiz a try, check your answers below.
1) What fraction is the shaded part of this fraction bar?
b) \(\displaystyle \frac{3}{2}\)
2) What type of bar model is shown below?
c) Comparison bar model
3) Which equation matches this bar model?
d) 24 ÷ 3 = ___
4) What is the value of the missing number in this bar model?
a) 12


 (972) 939-6284
 (972) 939-6284