Pictographs, also called picture graphs, are one of the first graphs children learn to read in school. To read one, students need several skills at once, which can confuse young learners.
If your child isn't sure where to start, a few clear steps can help.
Our tutors work with elementary students on graphs like these every week. Today, we'll explain what a pictograph is and walk you through how to read one in five clear steps.
What Is a Pictograph?
Pictographs are graphs that use pictures or symbols to show how many items belong in each category. Like other types of graphs, they help readers organize and compare data.
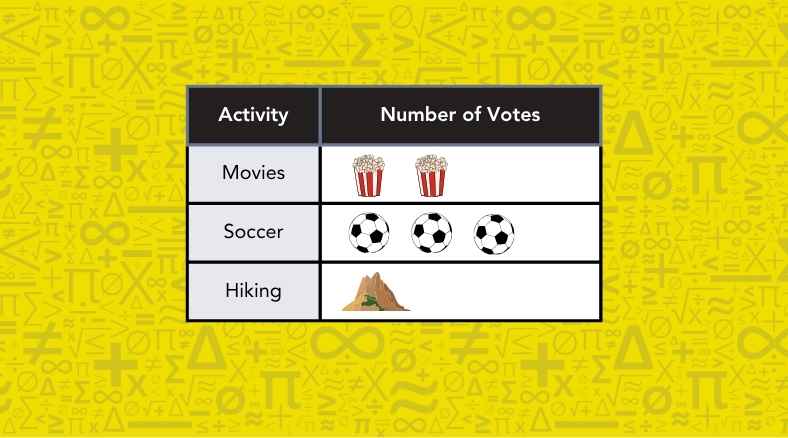
Here's a simple example. In one class, students voted for their favorite activity. This pictograph shows how many votes movies, soccer, and hiking received:
Every pictograph has four parts:
-
Title. The title tells readers what the graph is about. Our example uses column headings in place of a title. "Activity" and "Number of Votes" tell your child that the graph counts votes for each activity.
-
Category labels. The labels name each group being counted. In our example, we listed the three activities.
-
Symbols. Each row has pictures that stand for the data. For instance, our graph uses popcorn for movies, soccer balls for soccer, and a mountain for hiking. The pictures look different, but they all count the same way.
-
Key. The key tells readers how much one picture is worth. Our graph has no specific key, so each picture stands for one vote. For example, soccer has 3 soccer balls, which means it received 3 votes.
Outside of math class, we can see pictographs in real life, such as a weather report that uses raindrops to show how much rain fell, the stars on a movie or restaurant review, and the chili peppers on a menu that show how spicy a dish is.
How to Read a Pictograph
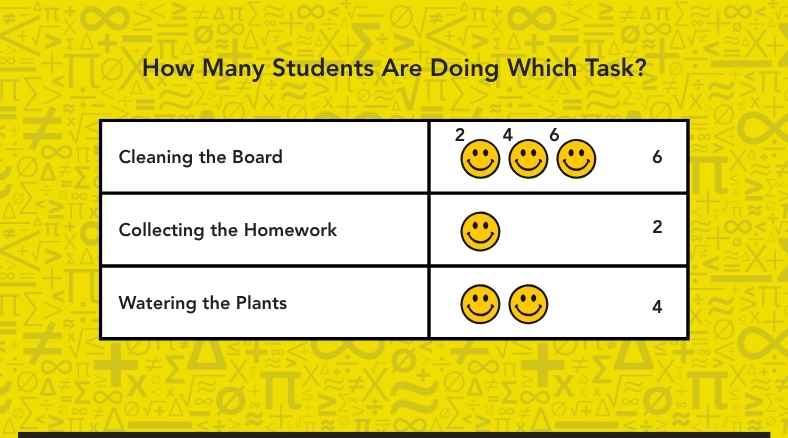
This pictograph shows how many students in one class are doing each classroom task.
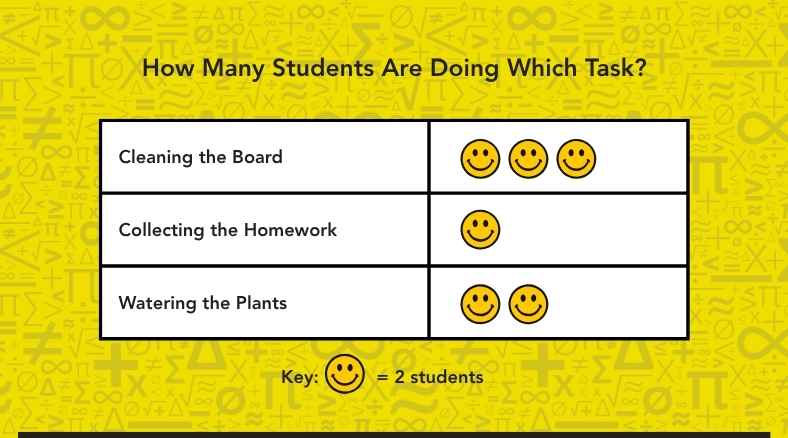
This time, our graph includes a key.
Let’s practice how to read it in the next five steps.
1. Read the Title and Category Labels
Start by reading the title.
The title of our example asks, "How Many Students Are Doing Which Task?"
So what are we counting? We are counting students!
Next, look at the category labels together. This graph compares three classroom tasks, which are 1) cleaning the board, 2) collecting the homework, and 3) watering the plants.
2. Find the Key
The key tells us how to read the pictograph by explaining what each symbol means. Sometimes, in simple graphs, we can figure it out ourselves.
In our example, the key shows that one smiley face stands for 2 students.
Students who skip the key usually count each face as one student. On this graph, that mistake would make every total half of the correct amount.
3. Count the Symbols in Each Row
Once we know how to read the symbols, we can count them in the pictograph.
Let’s count the smiley faces in each row:
-
Cleaning the Board: 3 faces
-
Collecting the Homework: 1 face
-
Watering the Plants: 2 faces
4. Use the Key to Find Each Total
All that is left now is to apply the key to the number of symbols we counted. In our case, we will be multiplying the number of symbols in each row by two.
To find how many students are doing each task, we can also use skip counting by the key's value. For Cleaning the Board, for example, we would count by 2s three times (2, 4, 6) and get 6 students.
Alternatively, we can use multiplication as a shortcut. In that case, we would multiply the number of faces by the key's value.
-
Cleaning the Board: 3 faces × 2 = 6 students
-
Collecting the Homework: 1 face × 2 = 2 students
-
Watering the Plants: 2 faces × 2 = 4 students
Note that some pictographs also use half symbols. When one face stands for 2 students, half a face stands for 1 student.
📕 You May Also Like: How to Teach Math to Visual Learners with Pictures & Manipulatives
5. Compare the Rows and Draw Conclusions
With each total in hand, we will use the graph to answer questions about the data.
-
Most and fewest. More students are cleaning the board (6) than doing any other task. The fewest students are collecting the homework (2).
-
How many more. Two more students are cleaning the board than watering the plants. To find this difference, subtract 4 from 6.
-
Total. Twelve students are doing tasks in all. To find the sum, add 6 + 2 + 4.
Pictographs show how many items belong in each category. For example, to find out why students chose one task over another, you would need additional information.
📕 You May Also Like: The Role of Diagnostic Assessments in Mathnasium's Tutoring Program

At Mathnasium, we help students build lasting math skills by learning how to read information, recognize patterns, and use what they know to solve problems.
How Mathnasium of Coral Springs Helps Students Master Any Math Concept
Mathnasium is a math-only learning center helping students across K–12 excel in math.
Whether students need support with foundational skills, specific concepts like pictographs, or would like a challenge above their curriculum level, we can support them.
Our proprietary teaching approach, the Mathnasium Method™, is designed around each student's needs and learning style to help them learn and master math. Our approach includes:
-
Diagnostic Assessment: The first step in our approach is a diagnostic assessment. This relaxed interaction with students gives us clear insight into their potential skill gaps.
-
Personalized Learning Plan: From those insights, we build a personalized learning plan tailored to their needs, whether that means reading pictographs, interpreting data in graphs, or building the skills they need for more advanced data concepts in later grades.
-
Teaching for Understanding: We strip out confusing jargon and replace it with plain, accessible language. By combining verbal, visual, mental, tactile, and written techniques, we adapt to different learning styles and ensure every concept truly makes sense.
-
Problem Solving and Critical Thinking: We build dedicated time for independent work into every session, encouraging students to trust their own logic. When our instructors step in, we explain the "how" and "why" behind every method, helping bright students develop genuine problem-solving skills and critical thinking.
-
Fun Learning Environment: Fun is an integral part of our approach. We build game-based math activities into learning so students stay engaged while putting in the effort. Earning rewards keeps them excited and shows them just how far their effort can take them.
Our structured approach delivers proven academic outcomes:
-
94% of parents report an improvement in their child's math skills and understanding.
-
90% of students see an improvement in their school math grades.
-
93% of parents report a noticeable increase in their child's attitude toward math and overall academic confidence.
If your child needs extra support with pictographs, graphs, or other visual math concepts, schedule a free diagnostic assessment with Mathnasium of Coral Springs today.
We will assess their current skills and create a personalized learning plan to help them read visual information, understand what it shows, and solve related math problems.
📅 Schedule a Free Diagnostic Assessment at Mathnasium of Coral Springs
Not near Coral Springs?
📍 Find a Mathnasium Learning Center Near You


 (954) 441-6284