We took inspiration from this card created by Emily McDowell Studio and decided to create our very own mathy valentine using a pie chart!
Using an online pie chart program such as meta-chart you can pick your own categories for what you love the most!
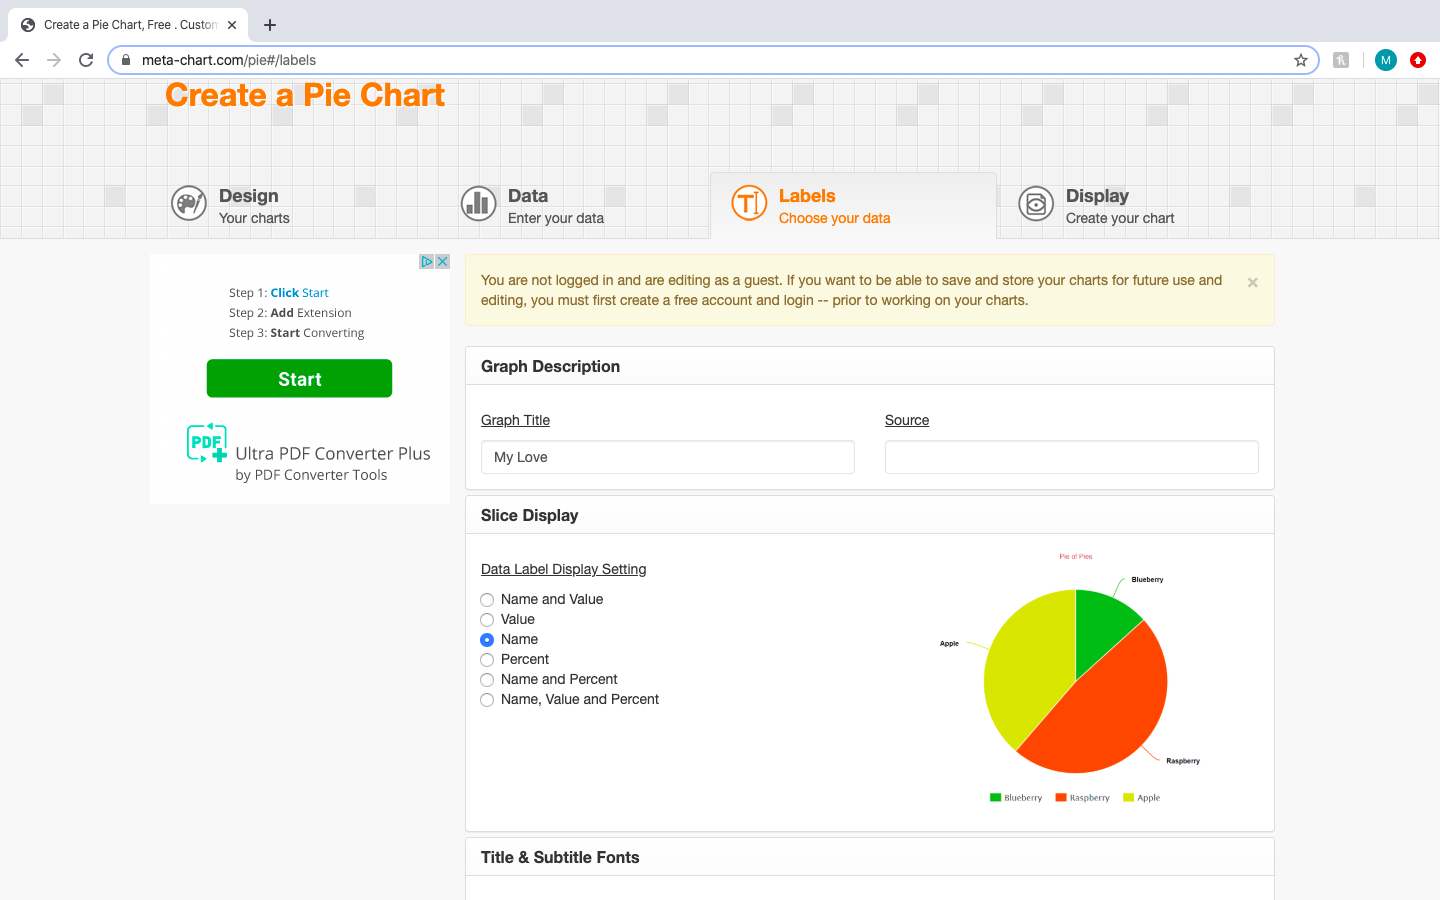
You’re welcome to use any software or website but we’ve included detailed instructions using meta-chart. Make sure to use the tabs along the top to navigate the page.
Design
Feel free to play around with different options. For our valentine we left the basic options the same.
Data
From here you can pick how many ‘slices’ you want and how big you want them to be. We recommend picking between 3 and 7 categories so your card will look fun but not be too busy.
A good idea for picking out your values is to start with 100% being the whole pie and assign a percentage to each item. Look in our “Take Aways” below if you need more help with this step!
You! (the person receiving the valentine) - 60%
Math - 30%
Puppies - 5%
Chocolate - 3%
Glitter - 2%
Labels
Name your Pie Chart! You can stick with the same title as the original card, ‘My Love,’ or come up with your own idea!
Again, feel free to play with the settings. Because we just wanted to know what each piece of pie represented and not the values we selected the option for ‘Name’ only.
Display
And you have your pie chart! You can download the image and print it off or edit it for your very own mathy valentine.
Take Aways
One of the things Mathnasium loves to teach is how percentages can be fun and painless. Try talking to your child about percent when assigning values in the ‘Data’ step above using some of the phrasing we use here in the center.
100% means “all of it”
50% means “half of it”
25% means “a quarter of it” (or “half of a half”)
0% means “none of it”
A good way to start picking your values might be to start by figuring out how big you want the biggest slice to be. We wanted the ‘You’ slice to be the biggest, and we wanted it to be equal to more than half of the pie so we used 60%. What do you want to do for yours? Do you want it to be bigger than half of the pie (more that 50%), equal to half of the pie (exactly 50%), or less than half of the pie (between 0 and 50%)? Try out some different numbers to see how that affects your pie chart.
Once you have the first slice picked out you can subtract that number from 100 to figure out how much you have left. In our case we would say that 100 - 60 = 40 so our next slice needed to be smaller than 40.
Thinking about how much I have left, we wanted the ‘Math’ slice to be bigger than half of the remaining pie. Half of 40 is 20, so any number bigger than 20 and less than 40 would have worked. We chose 30. Once we picked our number we could again subtract to find out how much we have left for our other three slices.
40 - 30 = 10. So we had 10% left to split up among the rest of our pie. We decided to make ‘Puppies’ half of the remaining pie. Half of 10 is 5. After that we had 5% of our pie left, so we split that into 2 and 3.
We’d love to see your Mathy Valentines! Share them with us on our Facebook page or bring them into the center to share with the Mathnasium team!