Coordinate geometry, also known as Cartesian geometry, is a fundamental branch of mathematics that merges algebraic techniques with geometric concepts. At its core lies the Cartesian coordinate system, which provides a framework for precisely describing points, lines, curves, and shapes in a two-dimensional plane. Plotting points on a graph is the foundational skill in coordinate geometry, serving as a gateway to understanding more complex concepts like distance, slope, and equations of lines.
Understanding the Cartesian Coordinate System:
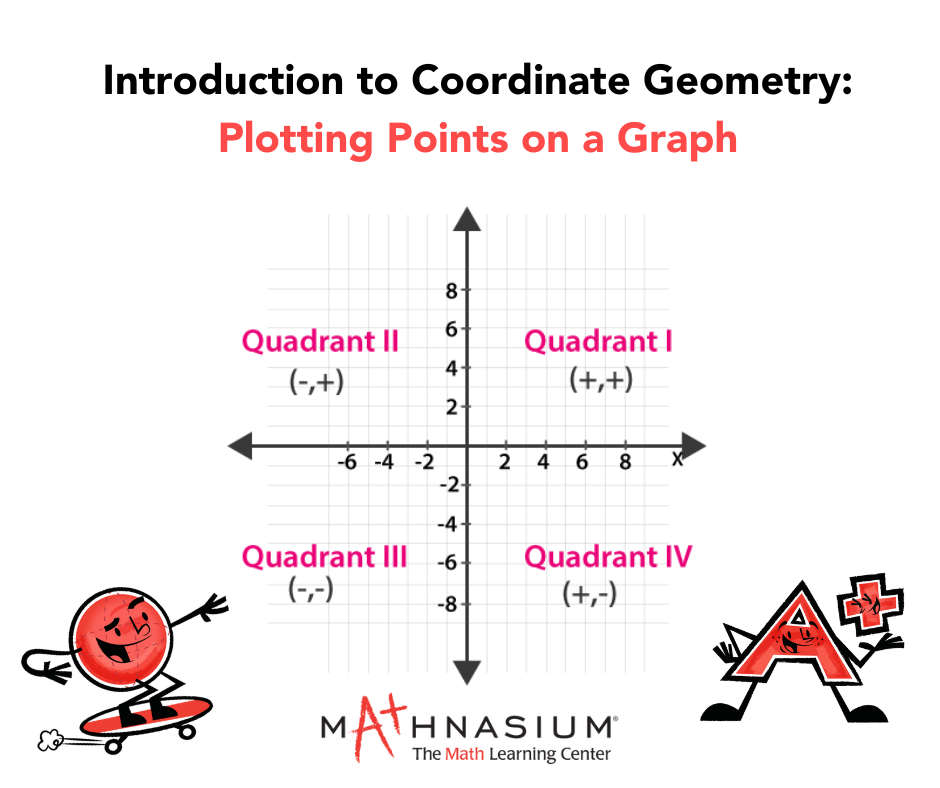
The Cartesian coordinate system was developed by René Descartes in the 17th century and revolutionized mathematics by providing a way to represent geometric figures algebraically. It consists of two perpendicular lines known as the x-axis and the y-axis, intersecting at a point called the origin, typically denoted as (0,0). These axes divide the plane into four quadrants: the first quadrant is where both x and y coordinates are positive, the second quadrant is where x is negative and y is positive, the third quadrant is where both x and y are negative, and the fourth quadrant where x is positive and y is negative.
Plotting Points:
To plot a point on the graph, we need two coordinates: an x-coordinate and a y-coordinate. The x-coordinate tells us how far left or right the point is from the origin, while the y-coordinate tells us how far up or down the point is from the origin. For example, point (3,2) would mean moving three units to the right along the x-axis and two units upwards along the y-axis from the origin.
Positive and Negative Coordinates:
In the Cartesian coordinate system, positive x-values are to the right of the origin, and negative x-values are to the left. Similarly, positive y-values are above the origin, and negative y-values are below. For instance, the point (-4,3) would be four units to the left of the origin and three units above it.
Using Grids and Scales:
Graph paper is commonly used to plot points and draw geometric figures. The paper is divided into small squares, with each square representing a unit length on both the x and y-axes. By using the grid lines as guides, plotting points becomes a matter of counting units along each axis. For example, to plot the point (2,-3), we move two units to the right along the x-axis and three units down along the y-axis.
Applications in Real Life:
Coordinate geometry has numerous applications in various fields, including physics, engineering, geography, computer graphics, and more. For instance, in physics, it's used to represent the motion of objects in space. In engineering, it helps design structures and analyze their geometric properties. In geography, it aids in mapping locations on the Earth's surface. In computer graphics, it's essential for rendering images on screens.
The ability to plot points on a graph is a fundamental skill in coordinate geometry, laying the groundwork for more advanced concepts and applications. By understanding the Cartesian coordinate system and how to interpret coordinates, one gains a powerful tool for representing and analyzing geometric figures. Whether in mathematics, science, or technology, coordinate geometry continues to play a vital role in solving real-world problems and understanding the relationships between objects in space.


 (516) 484-6284