Numbers can tell very different stories depending on how you look at them. The average is the most commonly used tool for summarizing data, but it has a weakness: a single unusually high or low value can pull it away from what's actually typical.
That's why statisticians, economists, and researchers turn to the median instead.
Today, we will walk you through what the median is, how to calculate it, and why it is often the more accurate way to describe a set of data.

What Is the Median?
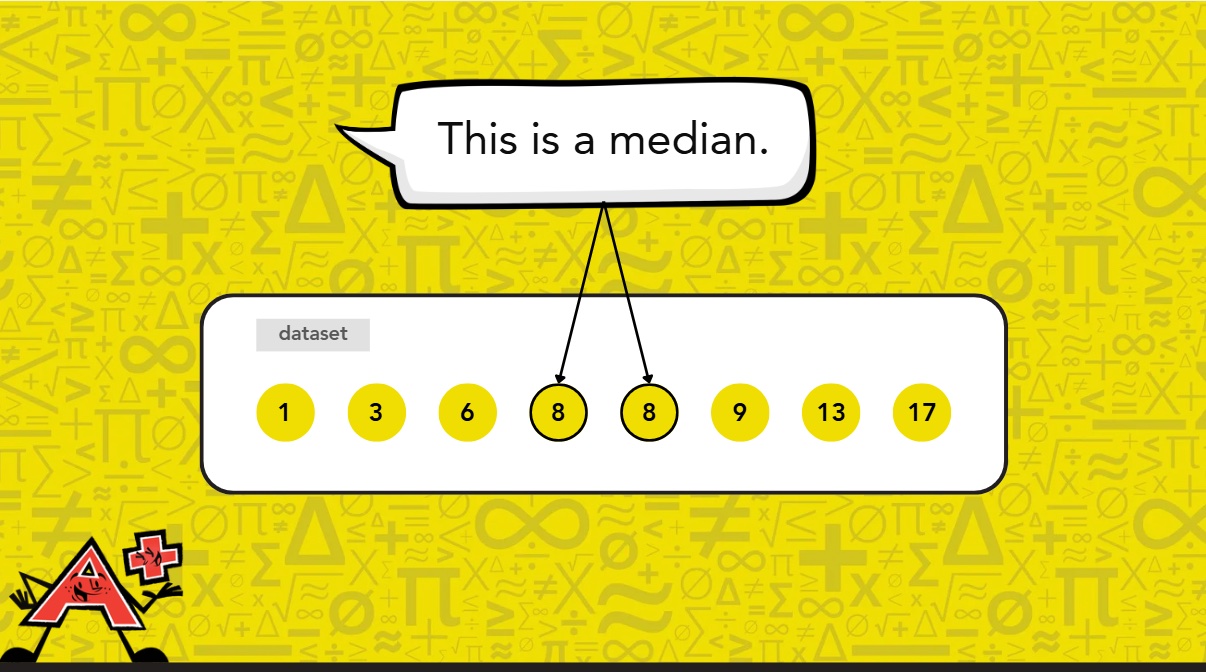
The median is the middle value in a dataset when the values are arranged in order from smallest to largest. It splits the data into two equal halves: half the values fall below it, and half fall above it.
The word comes from the Latin medianus, meaning "middle." Think of the median as a strip on a highway, the line running right down the center, dividing both sides equally.
Mean vs. Median vs. Mode
In statistics, students typically encounter three measures of center:
-
Mean (Average): the average, calculated by adding all values and dividing by the number of values in the dataset
-
Median: the middle value in an ordered dataset
-
Mode: the value that appears most frequently in the dataset
Each one answers a slightly different question about the same data.
The mean tells you the average value if everything were distributed equally. The median tells you what a typical value looks like by finding the middle point. The mode tells you which value shows up most frequently.
The key difference comes down to outliers. An outlier is a value that sits far above or below the rest of the data.
The mean is sensitive to outliers because it factors every value into the calculation equally. The median is not, because it only looks at position and not value. It doesn't matter how extreme an outlier is. It still only counts as one value in the ordered list.
Depending on what you are trying to understand about a dataset, one of these will give you a clearer, more useful answer than the others.
In data analysis, choosing the right measure is just as important as calculating it correctly.
📕 You May Also Like: What Are Mean, Mode, Median & Range in Math?

How to Calculate the Median
Calculating the median always starts the same way:
-
Arrange the values in order from smallest to largest.
-
From there, the next step depends on whether the dataset has an odd or even number of values.
Here is how each case works.
When the dataset has an odd number of values
Start by arranging the values in order from smallest to largest. Once the values are in order, the median is simply the value sitting right in the middle, with an equal number of values on either side of it.
Let's work through an example. Here are the quiz scores of seven students:
62, 70, 74, 78, 81, 85, 90
There are 7 values. Since 7 is an odd number, there is one value sitting exactly in the middle. To find it, we need to figure out which position that is.
Think of it this way: if there are 7 values, the middle one has 3 values below it and 3 values above it. That puts it in the 4th position.
A quick way to find that position for any odd-numbered dataset is:
(n + 1) ÷ 2, where n is the total number of values.
(7 + 1) ÷ 2 = 4
Counting through the ordered list to the 4th position gives us 78.
Half the scores fall below 78, and half fall above it. That's the median.
When the dataset has an even number of values
With an even number of values, there is no single value sitting exactly in the middle. Instead, there are two values sharing the middle position, one on each side of the center.
Let's use the same group of students, this time with one extra score added:
62, 70, 74, 78, 81, 85, 90, 94
There are 8 values. Using the same approach as before:
(8 + 1) ÷ 2 = 4.5
A position of 4.5 tells us there is no single middle value. The median sits between the 4th and 5th positions. Counting through the ordered list, those values are 78 and 81.
Now, to find the median, we need one number that represents the midpoint between 78 and 81. The way to find the midpoint between any two numbers is to calculate their mean by adding the two values together and dividing them by 2:
(78 + 81) ÷ 2 = 159 ÷ 2 = 79.5
The median is 79.5.
This is the step students most commonly miss. They find the two middle numbers but forget to average them.
📕You May Also Like: What Is an Outlier in Math? Explained For Middle School
How We Use the Median in Everyday Life
The median might feel like it's only a math class concept, but it actually comes up in real life more than you may realize.
You'll find it in your child's school progress reports, in sports statistics their favorite teams publish, and also in news reports about housing costs in your neighborhood.
Here are three everyday situations where people use the median to make better calculated decisions.
1. How a basketball player is really performing
Coaches don't just look at the player's best game. They want to know what that player shows and delivers night after night.
The median score gives them exactly that, a realistic picture of what to expect from a player on any given night, which helps them make smarter decisions about playing time and game strategy.
2. How much a typical family earns
You've probably come across the phrase "median household income" in a news article or a social studies class.
It's the number governments use to understand what most families actually take home, which helps them make decisions about things like taxes, housing support, and school funding.
3. Tracking video game scores
Imagine a group of friends who play the same game every weekend and want to know who's actually the best player over time, not just on their best day.
The median score gives them a fair answer. It shows what each person typically scores, week in and week out, making it a much more honest way to compare performance.
📕You May Also Like: Top 5 In-Demand Math Careers for Students Who Love Math

Mathnasium math tutors use natural language and face-to-face tutoring, paired with a combination of verbal, visual, mental, tactile, and written teaching techniques.
How Mathnasium Helps Students Master Statistics and Data Analysis
At Mathnasium, we don't treat the median as just one, isolated topic but as one of the many concepts we use to build understanding, reinforce analytical thinking, and connect math to real meaning.
That's part of a broader teaching strategy we call the Mathnasium Method™, our proprietary approach designed to help students develop deep, lasting comprehension.
To build a deep understanding of math, our approach relies on:
-
Personalized learning plans: Each student starts with a diagnostic assessment that reveals their strengths, knowledge gaps, and how they process math. These insights allow us to create a learning plan tailored to their exact needs.
-
Teaching for understanding: Our math tutors use natural language and face-to-face tutoring, paired with a combination of verbal, visual, mental, tactile, and written teaching techniques. When it comes to statistics, this means students might talk through why the median is more reliable than the mean in a given dataset, sketch out a number line to visualize the middle value, or work through real-world data to make the concept feel meaningful rather than abstract.
-
Caring, specially trained tutors: Mathnasium tutors are trained not only in math but also in how to teach it with patience and empathy. They know when to slow down and walk through a tricky dataset step by step and when to challenge a student to think more critically about which measure of center fits the situation. That balance builds both skill and confidence.
-
Independent problem solving and critical thinking: During each session, students have time to work through problems independently before reconnecting with their instructor to review and refine their approach. Our goal is to develop confident, self-reliant math thinkers. As we guide them, we focus on both the how and the why behind each answer, strengthening the reasoning skills they'll use across all areas of math.
-
Singular focus on math: We specialize in math and math only. Our program includes thousands of carefully developed materials, continually refined to reflect how students best learn, understand, and retain math skills.
-
Fun, confidence-building environment: Parents often tell us that Mathnasium sessions don't feel like traditional lessons. Many activities are game-based, and we include frequent rewards to recognize progress. This keeps students engaged, motivated, and proud of what they're accomplishing.
The results speak for themselves:
-
94% of parents report an improvement in their child's math skills and understanding
-
93% of parents report an improved attitude toward math after attending Mathnasium
-
90% of students saw an improvement in their school grades
With over 1,100 learning centers across the U.S., Mathnasium brings top-rated math tutoring to communities nationwide.
For families based in or near St. George, UT, Mathnasium of St. George is a trusted local center with years of experience helping students of all skill levels truly understand math. We proudly serve families in St. George, Washington, Santa Clara, Ivins, Hurricane, and surrounding communities.
Whether your child is looking to catch up, keep up, or get ahead in math, our team is ready to help.
📅 Schedule a Free Diagnostic Assessment at Mathnasium of St. George
Not located near St. George?
📍 Find a Mathnasium Learning Center Near You


 (435) 767-0335
 (435) 767-0335