Your class just voted on where to go for the end-of-year field trip. The zoo got some votes, the science museum got some, and so did the aquarium. You wrote every answer down, but now you have a list of 25 options, and you still can't tell which place has won.
To make sense of the data you collected, you have to organize it, and the easiest way to do that is with a frequency table.
Today, Mathnasium tutors will walk you through everything you need to know about frequency and frequency distribution tables: what they are and how to build one.

What Is a Frequency Table?
A frequency table is a simple way to organize information so you can see how often something happens.
It lists categories in one column and shows the number of times each category appears in another column.
The word “frequency” means how many times something happens.
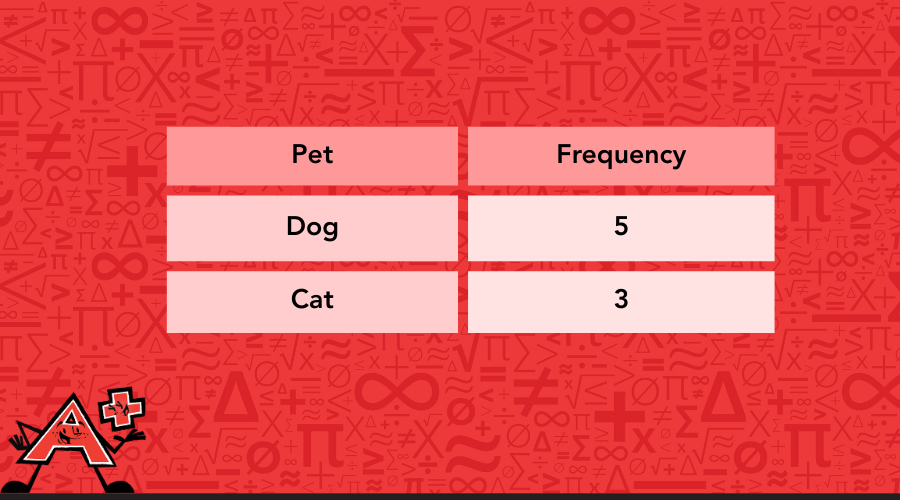
If five students in a class have a dog, the frequency of “dog” is five. If three students have a cat, the frequency of “cat” is three.
A frequency table takes all that counting and places it into a neat chart with categories in one column and totals in the other, like so:
Think of it as a sorting tray for numbers. Instead of leaving information scattered across a page, a frequency table lines everything up so patterns are clear right away.
By using a frequency table, you can quickly answer questions like:
-
Which choice was most popular?
-
Which category had the smallest number?
-
Are the results close together or very different?
Students start working with frequency tables in elementary school because they strengthen two important math skills at once: careful counting and organized thinking.
In later grades, these tables lead directly into bar graphs, line plots, and more advanced data analysis.
How to Make a Frequency Table
Here's how to turn a messy list into a clear, organized frequency table, one step at a time.
Step 1: Collect Your Data
Before you can draw anything, you need information to work with.
Let’s say a teacher asked 12 students their favorite season, and the answers were:
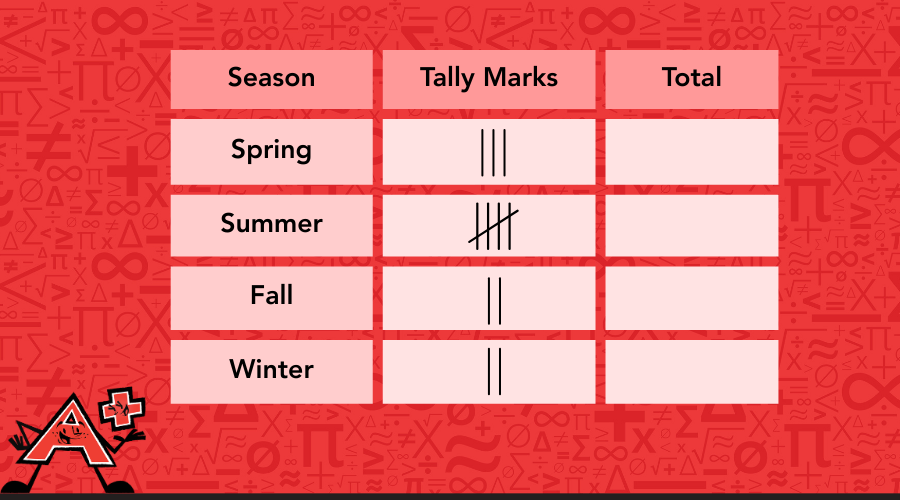
Spring, Summer, Fall, Summer, Winter, Spring, Summer, Fall, Summer, Winter, Spring, Summer
That’s our raw data.
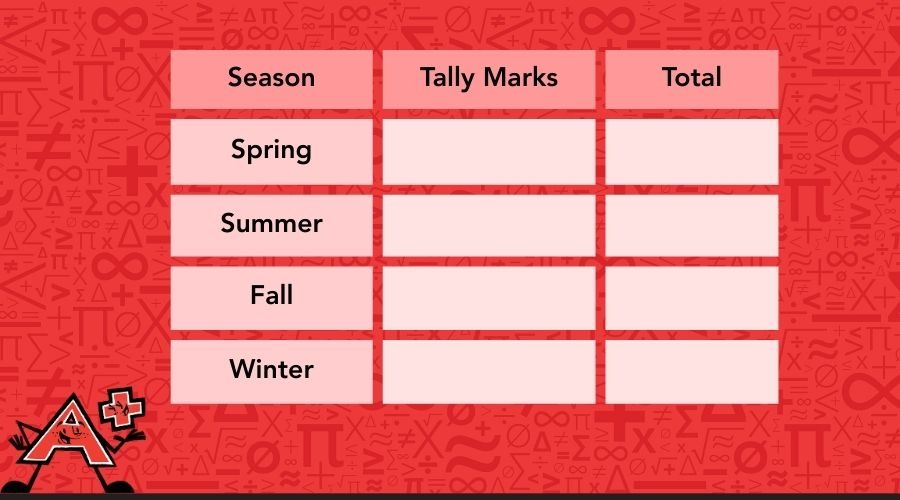
Step 2: List Your Categories
For favorite seasons, your categories are:
-
Spring
-
Summer
-
Fall
-
Winter
Every category gets its own row.
Step 3: Use Tally Marks
Now we use tally marks.
Tally marks, or simply tallies, are lines that help us count data. Each line stands for one item. Instead of writing numbers, we use marks to keep track as we go.
The classic trick here is to draw four lines and then cross through them on the fifth, which will make it really easy to count groups of five later.
Take your time with this step and go in order so you don't accidentally skip anything.
Step 4: Count the Totals
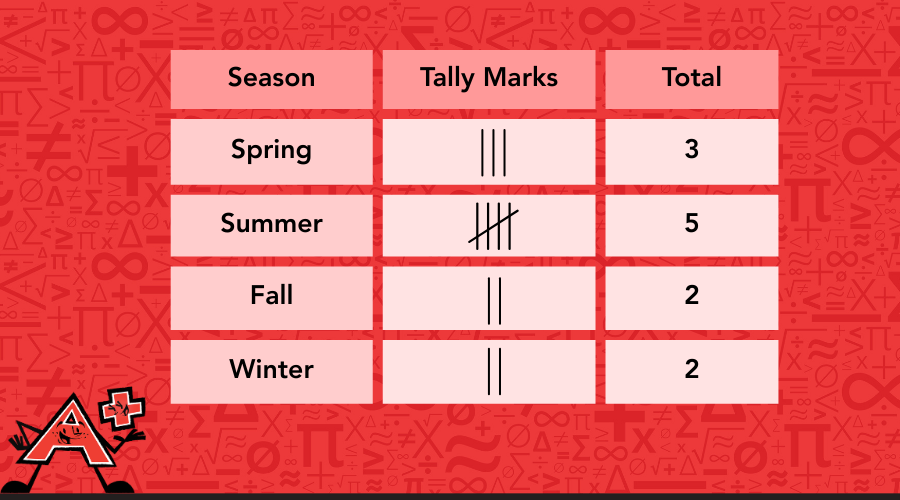
Once all your tally marks are in place, count them up for each category and write that number in the frequency column.
Those numbers are your frequencies; they tell you exactly how many times each category showed up in your data.
For this example, we have:
3 + 5 + 2 + 2 = 12
That matches our original 12 answers.
Step 5: Check Your Work
Here's a step a lot of kids skip, but you should do it every time: add up all your frequencies at the bottom of the table.
That total should match the total number of data points you started with. If it doesn't, you missed something or counted twice, and it's much easier to catch it now than later.
📕 You May Also Like: How to Use Tally Marks to Count and Organize Data
What Is a Frequency Distribution Table?
You already know that a frequency table helps you count how many times an item appears.
A frequency distribution table does something similar; instead of listing every single number separately, we group them into intervals.
For example, imagine you asked every student in your class how many books they read last summer. Some kids read 1, some read 5, and some read 12. If you listed every single number on its own row, your table would be huge and pretty hard to read.
A frequency distribution table solves that problem by grouping the numbers together, like 1 to 3 books, 4 to 6 books, 7 to 9 books, and so on.
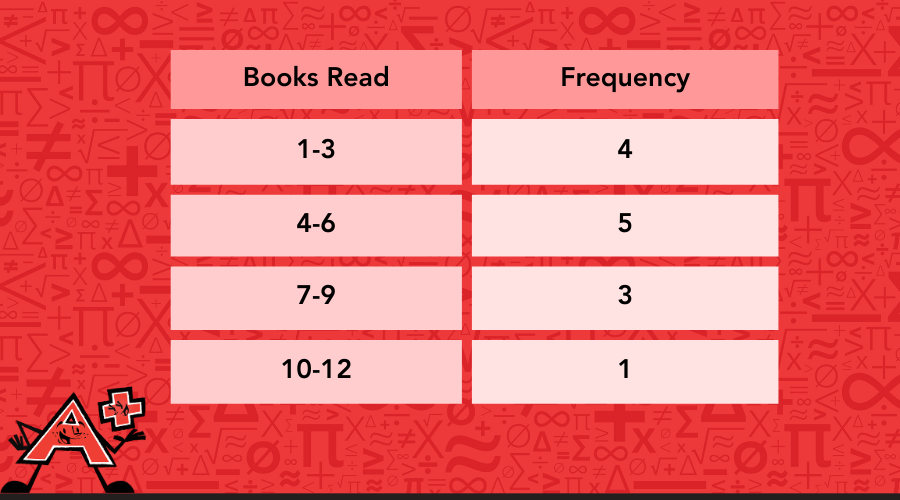
With a frequency distribution table, it’s easier to see that:
So what's the real difference between a basic frequency table and a frequency distribution table?
A basic frequency table works best when you don't have many different values. Tracking favorite colors, counting pet types, or tallying votes in a class election will all work perfectly in a basic table because the categories are simple and limited.
A frequency distribution table is what you use when your data covers a wide range of numbers. Instead of giving every value its own row, you group them into intervals so the table stays manageable and patterns are easier to spot.
How to Create a Frequency Distribution Table
Here's how to build one, step by step.
Step 1: Collect Your Data
Before you can create the table, you need numbers to work with.
Let's say 12 students were asked how many books they read over the summer, and the answers were:
1, 4, 7, 2, 9, 4, 6, 3, 8, 5, 4, 2
That's our raw data.
Step 2: Find Your Smallest and Largest Value
Scan through your data and find the lowest number and the highest number.
In our example, the smallest is 1, and the largest is 9.
This tells you how much range your table needs to cover.
Step 3: Choose Your Interval Size
Every interval in your table has to be the same size.
For beginners, groups of 3 or 5 work well. For this example, we'll use groups of 3:
Every interval gets its own row. Don't skip any, even if you think no data falls there.
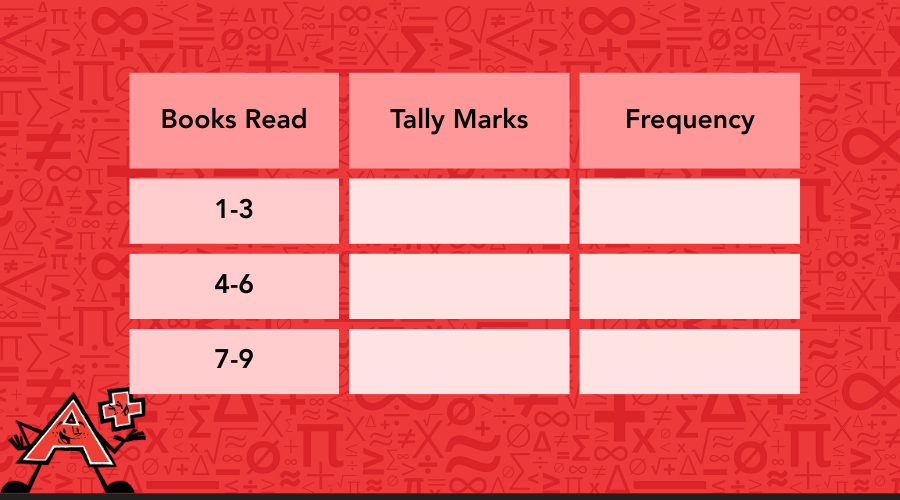
Step 4: Use Tally Marks
Go through your data one number at a time. Find which interval it belongs to and draw a tally mark in that row. Cross off each number as you go so you don't lose your place.
Just like a regular frequency table, draw four lines and cross through them on the fifth to make counting faster and cleaner.
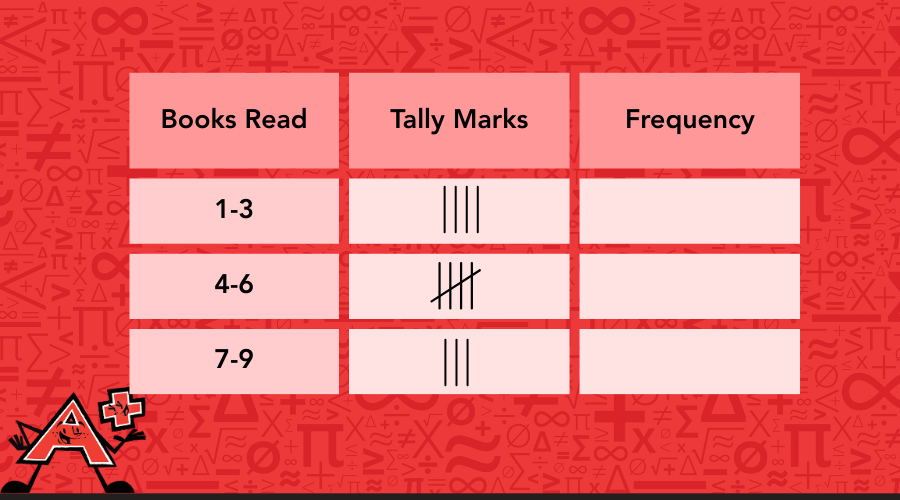
Step 5: Count the Totals
Count up the tally marks in each row and write that number in the frequency column.
For this example, we get:
-
1–3: 4 students
-
4–6: 5 students
-
7–9: 3 students
4 + 5 + 3 = 12
That matches our original 12 answers, which means every data point was counted once and landed in the right group.
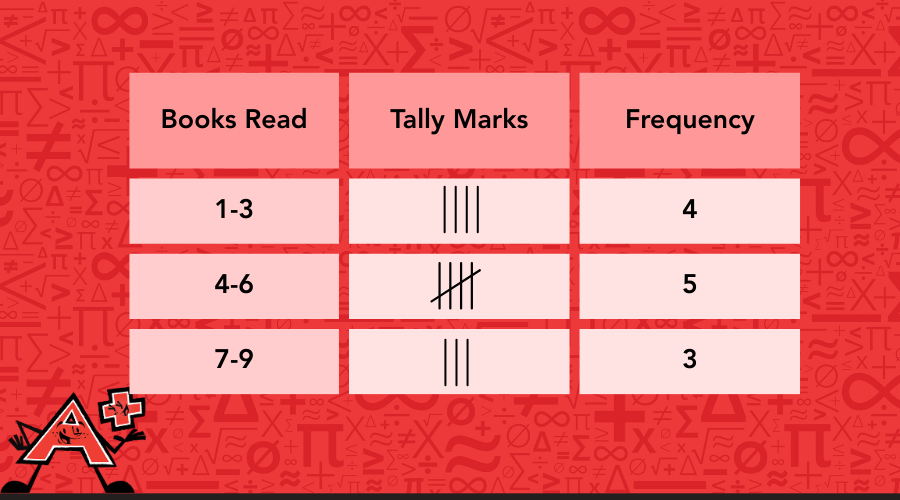
Step 6: Check Your Work
Add up all your frequencies at the bottom of the table. That total should match the total number of data points you started with. If it doesn't, go back and recheck your tally marks before moving on.

Through personalized learning plans and multi-sensory teaching techniques, Mathnasium helps students build a deep understanding of math.
How Mathnasium Helps Students Master Any Math Concept
A frequency table is one concept. Fractions, linear equations, exponents, and data analysis are others. What connects them all is the need for clear thinking and real understanding.
At Mathnasium, we teach for true mastery. That means students learn how to break down new material into manageable parts, recognize patterns within numbers, and explain their reasoning with confidence. They do not memorize a set of steps and hope they remember them later. They understand why those steps work.
This philosophy guides every session in the center.
Our proprietary teaching approach, the Mathnasium Method™, is designed to build understanding from the ground up.
To foster true mastery and enjoyment of math, our approach relies on:
-
Personalization on a granular level: Every student begins their enrollment with a diagnostic assessment. This allows us to identify their strengths, knowledge gaps, and how they think about math. Using these insights, we create a personalized learning plan that meets the student exactly where they are and builds skills in a clear, logical sequence.
-
Teaching for understanding: We explain math using clear, everyday language and support each concept with a blend of visual, verbal, written, mental, and hands-on techniques. By showing students not just what to do, but why it works, math becomes something they can understand rather than memorize.
-
Caring guidance: Our math tutors are trained not only in math but in how to support students emotionally and academically. They know how to encourage a student who’s feeling stuck and how to challenge one who’s ready for more, helping each child stay motivated and engaged.
-
Independent problem-solving and critical thinking: During sessions, we always set aside time for students to work through problems on their own. This helps them test their understanding and see both the how and the why behind each concept.
-
Singular focus on math: Mathnasium is math-only, and our program spans thousands of pages, refined over more than 20 years. This focused approach allows us to take a deep dive into how students best learn, retain, and enjoy math concepts at every level.
-
Empowering, fun learning environment: Our learning centers are designed to make math engaging. Lessons often include interactive and game-based materials. When learning feels fun, students are more curious, confident, and willing to keep going.
The results speak for themselves:
-
94% of parents report an improvement in their child’s math skills and understanding
-
93% of parents report an improved attitude toward math after attending Mathnasium
-
90% of students saw an improvement in their school grades
With more than 1,100 learning centers across North America, Mathnasium brings top-rated math instruction close to home.
For families in and around Farmington, UT, Mathnasium of Farmington is a trusted local center with experience helping students change how they think and feel about math.
Whether a student is catching up, keeping up, or getting ahead, our team is committed to helping them discover that math can make sense and be enjoyable.
Ready to help your child experience math in a whole new way?
📅 Schedule a Free Diagnostic Assessment at Mathnasium of Farmington
Not near Farmington?
📍 Find a Mathnasium Learning Center Near You


 (801) 928-7671
 (801) 928-7671