Math is a journey of connecting simple ideas to solve bigger problems. Long before students tackle complex statistics, they start by noticing patterns around them, like how tall their classmates are or how many pets their friends have. Line plots turn that curiosity into a clean, visual structure.
As students move through elementary school, line plots grow from tracking whole-number counts to organizing fractional measurements like half-inches and quarter-inches.
This shows students that math is about spotting trends and making sense of everyday measurements rather than just about finding one right answer.
Today, our Mathnasium tutors explain what a line plot is and how to create and read one, step-by-step and with visuals.

What Is a Line Plot?
A line plot is a simple graph that shows data along a number line using symbols, usually X's or dots, to represent frequency. It is one of the easiest ways for us to organize numbers, see patterns, and compare results at a single glance.
We can think of a line plot as a super-organized stack.
When we collect numerical data, such as game scores, the number of pets students have, or the length of an object, we place each result above its matching number on a number line. If more than one result is the same, we stack another X on top.
For example, suppose 10 students recorded how many pets they have at home. The line plot below organizes their results.

As we can see, the four Xs above 2 show that four students have 2 pets. Since 2 is the tallest stack, it is the most common number of pets in this group.
A great thing about line plots is that they help us:
-
Spot the most common value at a glance
-
See the greatest and least values in the data right away
-
Notice gaps when a number on the line has no Xs above it.

How to Create a Line Plot
To make a line plot, we need to:
-
Collect info, like a list of numbers, scores, or measurements.
-
Draw a straight line across the page and mark it with equal steps or numbers.
-
Stack a mark (like an X or a dot) above the right spot for every single item we count.
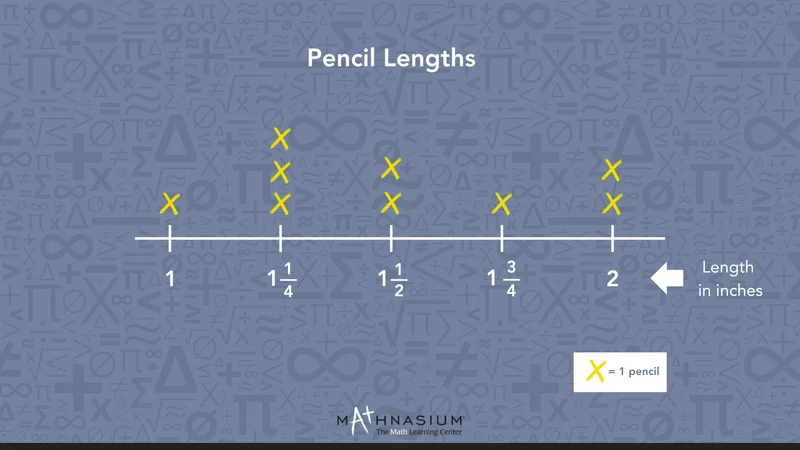
To see how this works, let’s try with one example. Suppose we have a set of pencil lengths (in inches): \(1, 1\Large\frac{1}{4}, 1\Large\frac{1}{2}, 1\Large\frac{1}{4}, 2, 1\Large\frac{1}{2}, 1\Large\frac{1}{4}, 1\Large\frac{3}{4}, 2\).
Let's create a line plot to organize these lengths.
Step 1: Look at the Lengths and Draw a Number Line
First, we look at the measurements to identify the smallest (1) and largest (2) measurements. With that in mind, we then draw a horizontal number line from 1 to 2, marking equal steps of \(\Large\frac{1}{4}\) inch (\(1, 1\Large\frac{1}{4}, 1\Large\frac{1}{2}, 1\Large\frac{3}{4}, 2\)).

Step 2: Label the Line
Now that we have a line with all measurements on it, we add a clear title. For example, we can say "Pencil Lengths" and label the line with the units of measurement "length in Inches".

Step 3: Plot the Data
With the line ready to work with, we now go through the measurements one by one and place an ‘’x’’ above the corresponding number on the line plot for each pencil. To make sure we don't miss any, let's analyze how many pencils we have of each length:
-
1 inch: 1 pencil
-
\(1\Large\frac{1}{4}\) inches: 3 pencils
-
\(1\Large\frac{1}{2}\) ( or \(1\Large\frac{2}{4}\)) inches: 2 pencils
-
\(1\Large\frac{3}{4}\) inches: 1 pencil
-
2 inches: 2 pencils
Now, we can stack that exact number of Xs vertically above each value on our number line.
Step 4: Double-Check the Count (Mathnasium Pro Tip!)
While this isn't a standard textbook step, it's one of our favorite habits to teach at Mathnasium. Before moving on, count the total number of X's on your line plot to make sure it matches the number of items in your original list.
In our example, both equal 9 pencils. Taking a quick second to double-check helps catch simple counting errors before they happen!
With our line plot completed, we have a clear, organized visual for analyzing our data. Instead of digging through a messy list of numbers, we can read the plot at a single glance to answer questions, spot patterns, and compare results effortlessly.
Let's now look at how we can use a completed line plot to answer math questions step-by-step.
📕 You May Also Like: How Number Lines Improve Math Understanding (Grades 1-5)
How to Read and Interpret a Line Plot
When we look at a line plot, those little X’s above the number line help us:
-
See the big picture fast.
-
Compare different stacks.
-
Solve fun math questions step-by-step.
By checking where the X's build up, we can:
Let’s try three quick examples together to see how easy this is! We'll start with simple counting and work our way up to multi-step questions.
Example 1: Find the Most Common Value
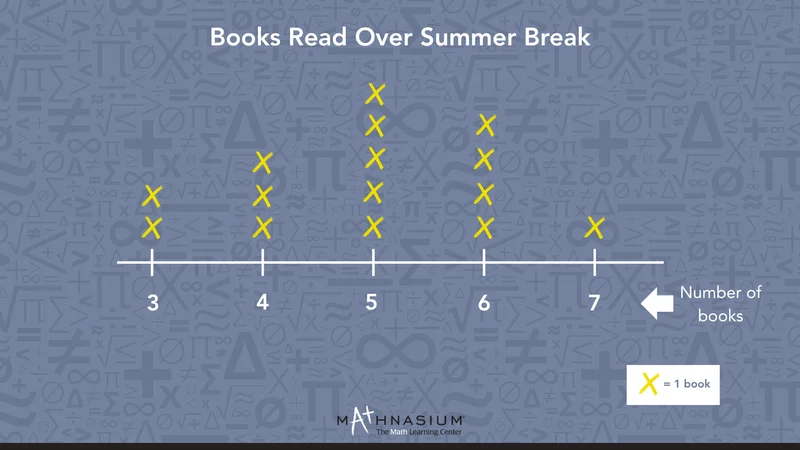
Members of the school book club recorded how many books they read during summer break. Let's find out how many books most members ended up reading.
Step 1: Scan the Line Plot
To find the value that appears most often, we look for the tallest column on the plot. Across the line, we see the numbers of books read are 3, 4, 5, 6, and 7.
Step 2: Identify the Highest Stack
Then, we look across the number line from left to right to look at the height of each stack. What do we see? The stack above 5 books has 5 Xs, which is higher than any other stack.
Step 3: Say the Final Answer
The most common number of books read in the club is 5.
📕 You May Also Like: The Surprising Link Between Reading Skills and Math Success
Example 2: Counting Data in a Range
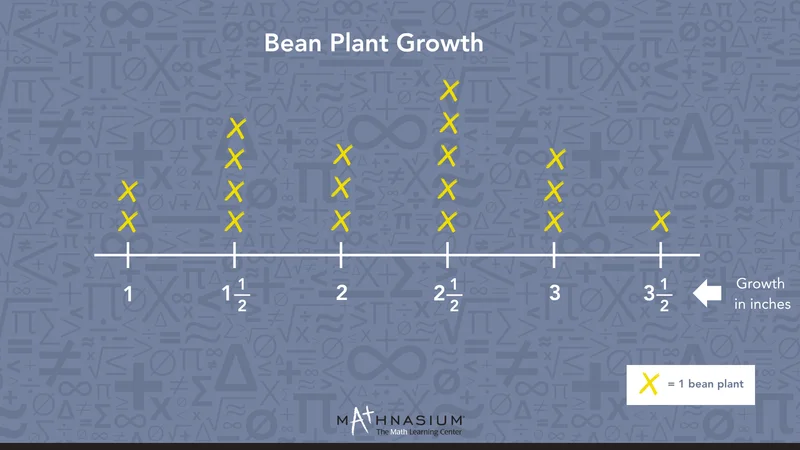
Science students tracked how many inches their bean plants grew over two weeks. Our task here is to find out how many bean plants grew more than \(2\Large\frac{1}{2}\) inches.
Step 1: Identify the Benchmark Value
To solve a "more than" question, first find the starting point on the line plot. In this case, our starting benchmark is \(2\Large\frac{1}{2}\) inches.
Step 2: Find the Target Range
Because the question asks for plants that grew more than \(2\Large\frac{1}{2}\) inches, we look only at the columns to the right of our starting point. We do not include \(2\Large\frac{1}{2}\). The numbers we need are 3 and \(3\Large\frac{1}{2}\) inches.
Step 3: Count the Data Points
Now, we count all the Xs in that target range:
Then, we add them together: 3 + 1 = 4.
Step 4: Say the Final Answer
There are 4 bean plants that grew more than \(2\Large\frac{1}{2}\) inches.
📕 You May Also Like: Greater Than and Less Than: A Simple Guide for Early Math
Practice Time: Check What You've Learned About Creating and Reading Line Plots
Ready to practice what we’ve covered? Practice creating and reading line plots and check your answers at the bottom of the guide. Good luck!
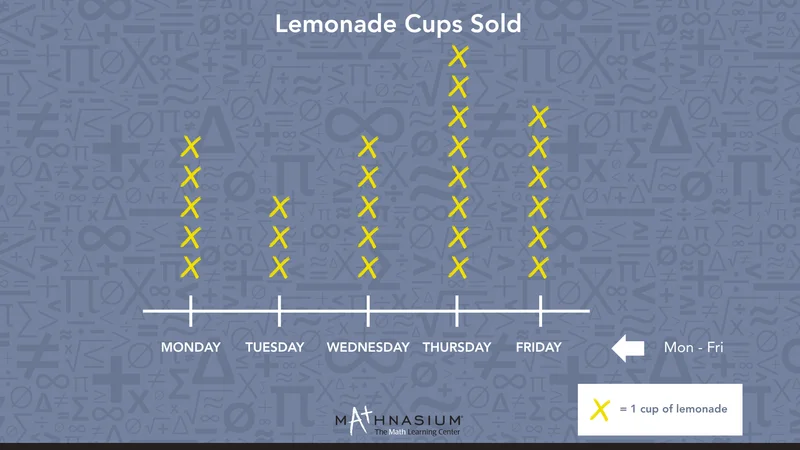
Challenge 1: During basketball practice, 10 students recorded how many free throws they made out of 10 tries. Use the data below to make a line plot.
4, 6, 5, 7, 6, 8, 5, 6, 4, 6
Challenge 2: The line plot below shows the number of new places a group of friends visited over summer vacation:

-
How many people visited exactly 2 new places?
-
How many people visited more than 2 new places?

Mathnasium tutors work face-to-face with students, guiding them step-by-step through line plots and data interpretation so the underlying logic naturally lands.
How Mathnasium Helps Students Master Line Plots (And Any Other Math Concept)
Mathnasium is a math-only learning center empowering students of all skill levels to learn and master math.
Line plots teach us how to organize and read data on a number line, building a solid foundation for future math concepts like graphing, analyzing trends, and understanding complex functions.
That is why whenever students come to us for support, whether they need to build foundational math skills or master a specific concept like line plots, we focus on teaching for deep understanding rather than memorized rules.
To build that level of understanding, we use a proprietary teaching approach called the Mathnasium Method™.
Each student begins their Mathnasium journey with a diagnostic assessment that helps us identify your child's strengths and knowledge gaps. From those insights, we build a personalized learning plan tailored to their needs and goals.
With the plan in place, our specially trained tutors follow it closely, delivering face-to-face instruction in a supportive and engaging environment.
When we teach concepts like line plots, we use plain, everyday language and a mix of verbal, visual, mental, tactile, and written techniques so the ideas make sense from more than one angle.
If your child gets stuck, we break the concept down into manageable parts, guiding them through both the how and the why. This builds the problem-solving skills and critical thinking tools they can use both in math classes and outside of them.
Fun is a core part of how we work. Our activities are often game-based and hands-on, and we celebrate every bit of progress, so confidence grows with every session.
The results reflect that approach:
-
94% of parents report an improvement in their child's math skills and understanding
-
93% of parents report their child's improved attitude toward math after attending Mathnasium
-
90% of students saw an improvement in their school grades
With over 1,100 learning centers across North America, there is a Mathnasium close to you.
For families in Naples and the surrounding communities, Mathnasium of Naples brings that same trusted approach close to home.
Whether your student is looking to catch up, keep up, or get ahead in math, our local team is happy to help.
📅 Schedule a Free Diagnostic Assessment at Mathnasium of Naples
Not near Naples?
📍 Find a Mathnasium Learning Center Near You
Pssst! Check Your Answers Here
If you've given our practice challenges a go, here are the answers.
Challenge 1:
Challenge 2: A) 4 B) 4


 (239) 455-6284