Imagine yourself in front of a mountain trail, looking at how steep it is. Is it a gentle incline you can walk up easily, or is it so steep that you might need climbing gear?
Finding the slope of a line is like figuring out the steepness of that trail. But instead of using hiking boots and ropes, we use math!
Whether you're new to slope, preparing for a test, or looking to sharpen your skills, this guide will take you through step-by-step instructions, clear examples, and plenty of practice to help you master it.
Meet the Top-Rated Math Tutors in Blue Ash, OH
What Is the Slope of a Line?
The slope of a line tells us how steep the line is and the direction it moves across a graph.
It measures how much the line goes up or down (on the y-axis) compared to how far it moves sideways (on the x-axis).
Speaking in math language, we represent slope using the formula:
\(\large m = \frac{\text{rise}}{\text{run}}\)
Let’s break this down:
Types of Slopes
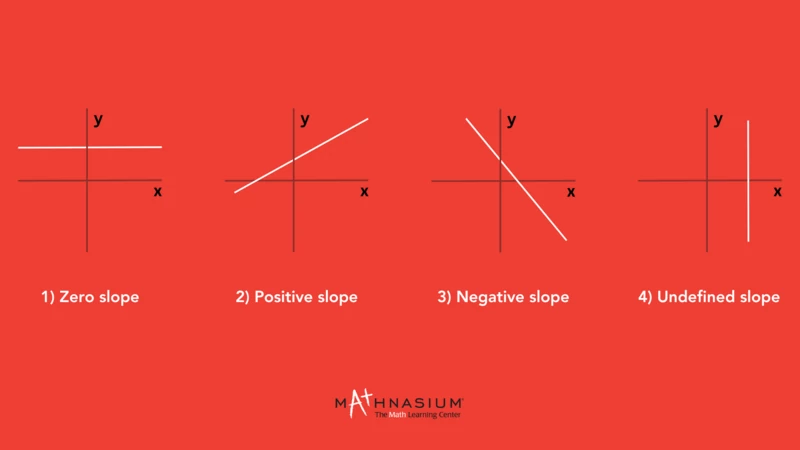
If we know the slope tells us how a line moves, we can group lines into different categories based on their direction.
We’ll start with the flattest slope and work our way up to the steepest.
-
Zero Slope: Imagine standing on a completely flat road or a calm lake. There’s no uphill or downhill movement—just a straight, level path. A line with zero slope doesn’t rise or fall; it just moves straight across.
-
Positive Slope: Think of a ramp leading up to a building or a roller coaster climbing its first hill. A positive slope means the line rises as it moves from left to right.
-
Negative Slope: Imagine skiing down a mountain or sliding down a playground slide. A negative slope means the line falls as it moves from left to right.
-
Undefined Slope: Like a straight-up wall or a flagpole, a line with an undefined slope doesn’t move sideways, only straight up and down. A vertical line has an undefined slope because there is no left or right movement—only rise.
We can see these slope types clearly when we plot them on a graph.
How to Find the Slope of a Line?
To find the slope of a line, we don’t really have to search for anything—we measure how steep the line is.
We do this by comparing how much the line moves vertically (up or down) to how much it moves horizontally (left or right).
Now, to determine exactly how much a line moves up or down and left or right, we need a visual tool—a coordinate plane.
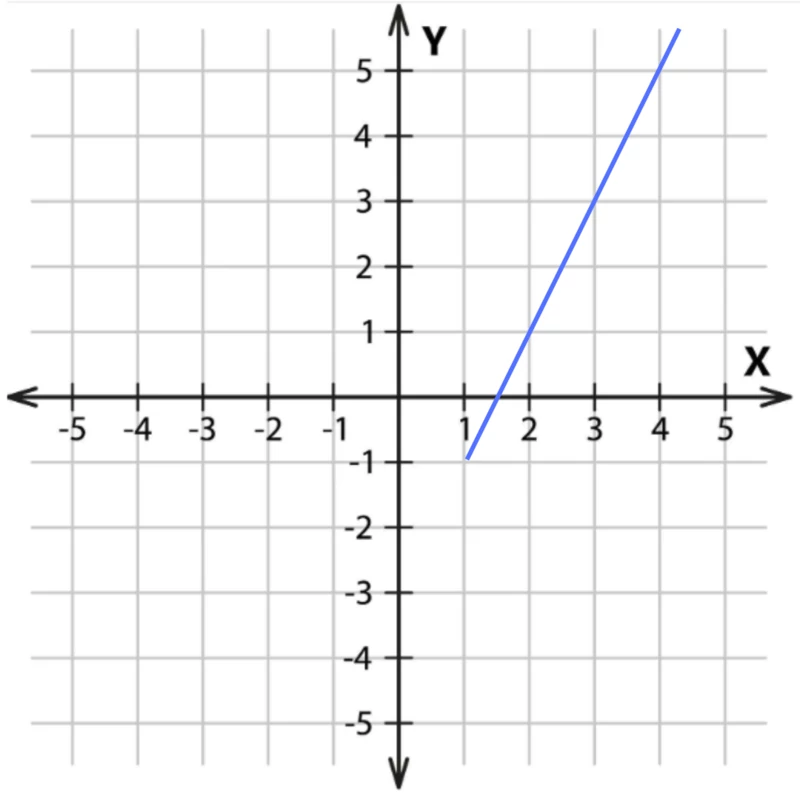
For now, we observe on the graph that the line is going up.
-
To measure its rise, we need to find how much it moves up along the y-axis. We’ll label that change Δy.
-
To measure its run, we find how much it moves right along the x-axis. We’ll call that change Δx.
Let’s write that in math terms:
\(\large m = \frac{\Delta y}{\Delta x}\)
Coordinate planes are made up of grids, which help us measure changes accurately. To do this, we find two points where the line lands on an exact point along the x- or y-axis as it goes left to right.
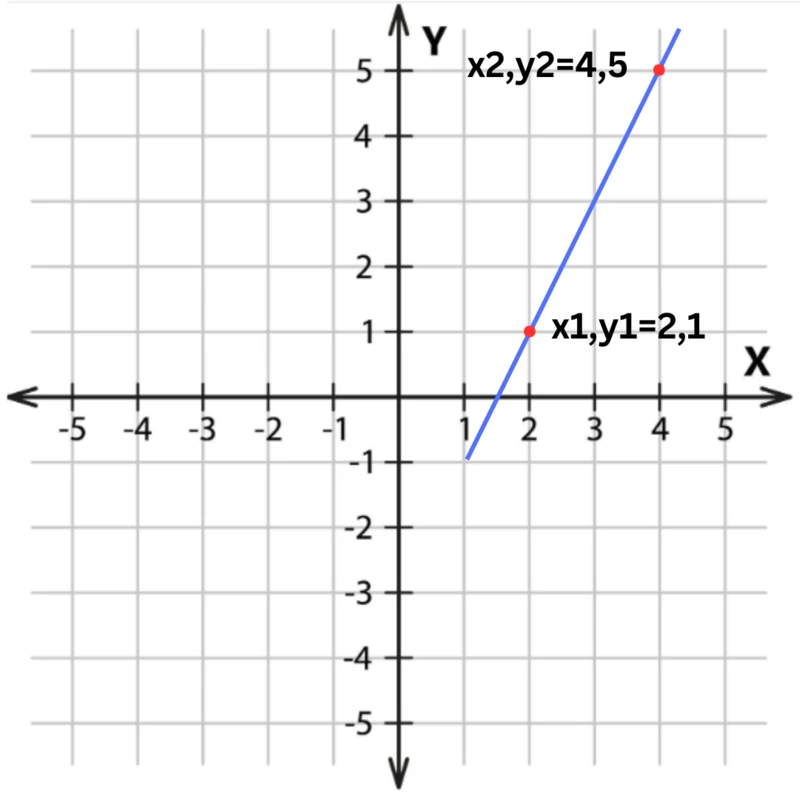
We’ve found two points on the line, each with its own x and y coordinates.
-
First point (the leftmost): x1,y1=2,1
-
Second point (the rightmost): x2,y2=4,5
To find the rise (Δy), we look at how much the y-values change between the two points. We subtract the first point’s y-value from the second point’s y-value:
Δy=y2-y1
To find the run (Δx), we measure how much the x-values change between the two points. We subtract the first point’s x-value from the second point’s x-value:
Δx=x2−x1
Since slope is rise over run, we divide these values:
\(\large m = \frac{\text{rise}}{\text{run}} = \frac{\Delta y}{\Delta x} = \frac{y_2 - y_1}{x_2 - x_1}\)
Now, we just have to substitute the values and do the math:
\(\large m = \frac{5 - 1}{4} - 2 = \frac{4}{2} = 2\)
The slope of the line is 2, meaning for every 1 unit the line moves right, it moves 2 units up.
And that’s how we find the slope of a line.
But what if we don’t have a graph?
No problem! As long as we have two points, we can still find the slope using the formula \(\large m = \frac{y_2 - y_1}{x_2 - x_1}\).
Solved Examples
Now that we know the principle and have the formula, let’s put it into action with a few more examples!
Example 1
Observe the line on the coordinate plane and find its slope.
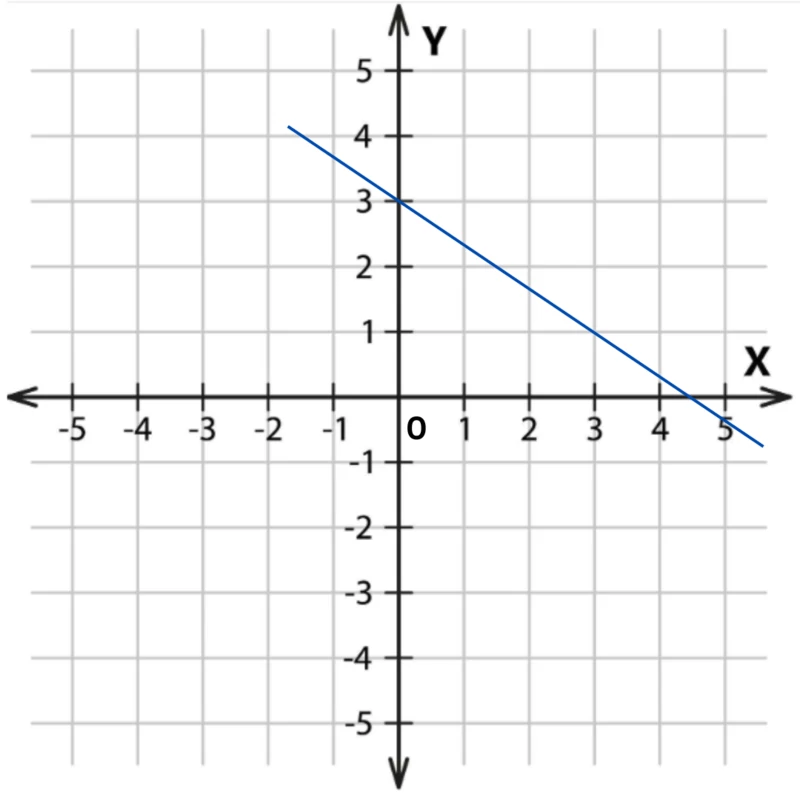
We can see that the line is going down, and it passes through the points (0,3) and (3,1) as it moves from left to right.
We label them as:
(x1,y1)=(0,3)
(x2,y2)=(3,1)
Since we have the coordinates, let’s calculate the slope!
\(\large m = \frac{y_2 - y_1}{x_2 - x_1}\)
And substitute the values:
\(\large m = \frac{1 - 3}{3 - 0} = \frac{-2}{3}\)
We’ve found that the slope is \(\large \frac{-2}{3}\), which means that for every 3 units the line moves to the right, it moves 2 units down.
Example 2
Now, let’s find the slope without a graph, using only the coordinates of two points.
The line goes through the points (-2,4) and (3,-1).
We label them like so:
(x1,y1)=(− 2, 4)
(x2,y2)=(3, −1)
Since we know the coordinates, we just need to calculate the rise over run and there we go: we have our slope!
\(\large m = \frac{y_2 - y_1}{x_2 - x_1}\)
Substitute the values:
\(\large m = \frac{-1 - 4}{3 - (-2)} = \frac{-5}{5} = -1\)
So, the slope is -1, meaning that for every 1 unit the line moves to the right, it moves 1 unit down.
Practice Time! Find the Slope
Now it’s your turn! Practice finding the slope using what we’ve learned.
When you’re finished, check your results at the bottom of the guide.
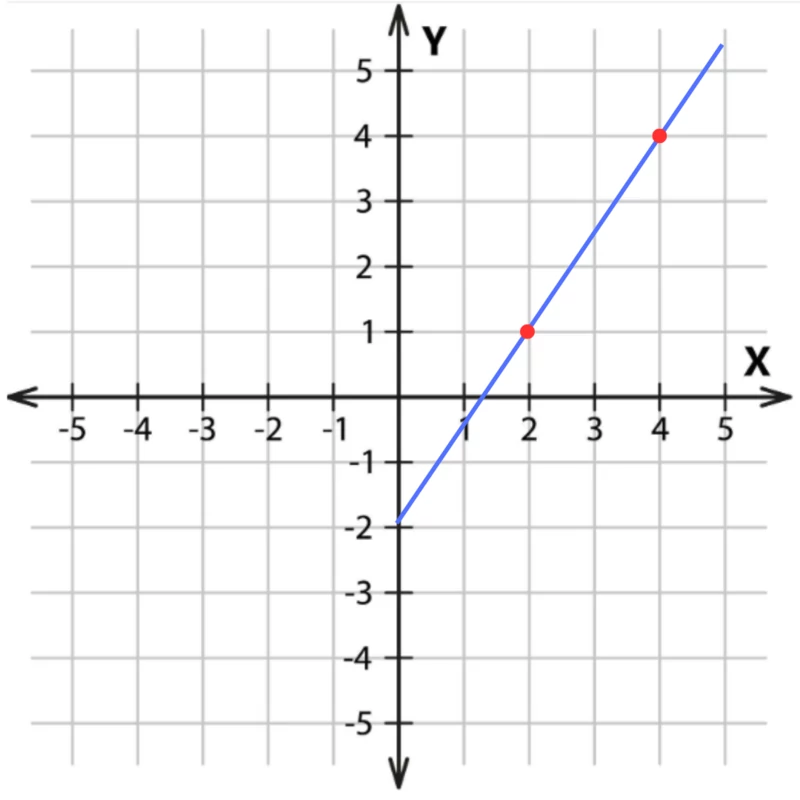
Task 1: Observe the graph and find the slope of the line.
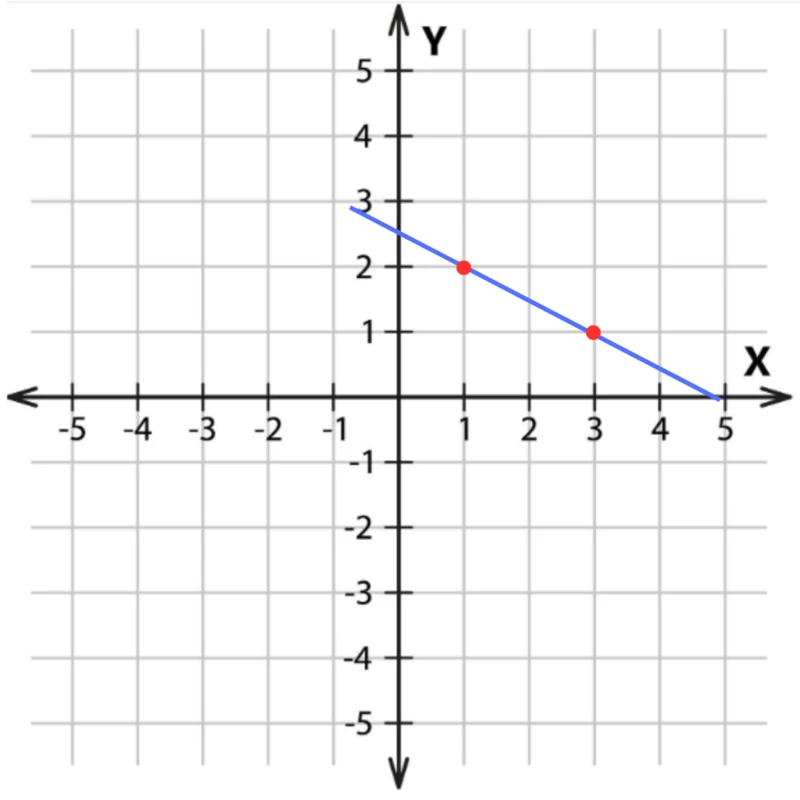
Task 2: Observe the graph and find the slope of the line.
Task 3: Find the slope of a line that passes through the points (−3, 2) and (1, 6).
Task 4: Find the slope of a line that passes through the points (-5, 3) and (2, −4).
FAQs About Finding the Slope
Here are the most common questions about the slope we get from our students at Mathnasium of Blue Ash.
1) What if I find the slope that’s not a whole number?
That’s okay! Slope can be fractions or decimals, not just whole numbers.
If your answer comes out as a fraction, don’t convert it to a decimal unless asked. Just simplify the fraction if possible!
2) Does it matter which point I pick as (x1, y1) and (x2, y2)?
Yes! To avoid sign mistakes, it’s best to pick the leftmost point (the one with the smaller x-value) as (x1,y1) and the rightmost point (the one with the larger x-value) as (x2,y2).
If you accidentally swap them, you’ll get the same number but with the opposite sign. If that happens, check your points—your slope should match what you see on the graph (positive for lines going up, negative for lines going down).
3) Can I use more than two points to find the slope?
Yes! If a line passes through multiple points, you can pick any two to calculate the slope, and you’ll always get the same answer. Just make sure they’re exact points on the grid!
4) Can I use more than two points to find the slope?
Yes! If a line passes through multiple points, the slope remains the same no matter which two points you pick.
However, the slope formula only works with two points at a time, so you’ll need to choose two of them to calculate it.
Master Finding the Slope at Mathnasium of Blue Ash
Mathnasium of Blue Ash is a math-only learning center for K-12 students of all skill levels in Blue Ash, OH.
Using a proprietary teaching approach called the Mathnasium Method™, our specially trained math tutors offer face-to-face instruction in an engaging and supportive environment to help students master any math class and topic, including finding the slope, typically covered in middle school math.
Students begin their Mathnasium journey with a diagnostic assessment that allows us to understand their unique strengths and knowledge gaps. Guided by assessment-based insights, we create personalized learning plans that will put them on the best path toward math mastery.
Whether your student is looking to catch up, keep up, or get ahead in their math class, schedule an assessment, and enroll at Mathnasium of Blue Ash today!
Schedule a Free Assessment at Mathnasium of Blue Ash
Psst! Check Your Answers Here
If you’ve given our exercises a go, check your answers below:
Task 1:
The coordinates are:
-
x1,y1=(2,1)
-
x2, y2= (4, 4)
Using the slope formula, we calculate:
\(\large m = \frac{y_2 - y_1}{x_2 - x_1} = \frac{4 - 1}{4 - 2} = \frac{3}{2}\)
Solution: The slope is 32, meaning for every 2 units right, the line moves 3 units up.
Task 2:
The coordinates are:
Using the slope formula, we calculate:
\(\large m = \frac{y_2 - y_1}{x_2 - x_1} = \frac{1 - 2}{3 - 1} = \frac{-1}{2}\)
Solution: The slope is -12, meaning for every 2 units right, the line moves 1 unit down.
Task 3:
The coordinates are:
Using the slope formula, we calculate:
\(\large m = \frac{y_2 - y_1}{x_2 - x_1} = \frac{6 - 2}{1 - (-3)} = \frac{4}{1 + 3} = \frac{4}{4} = 1\)
Solution: The slope is 1, meaning for every 1 unit right, the line moves 1 unit up.
Task 4:
The coordinates are:
-
x1,y1=(-5,3)
-
x2,y2=(2,−4)
Using the slope formula, we calculate:
\(\large m = \frac{y_2 - y_1}{x_2 - x_1} = \frac{-4 - 3}{2 - (-5)} = \frac{-7}{2 + 5} = \frac{-7}{7} = -1\)
Solution: The slope is -1, meaning for every 1 unit right, the line moves 1 unit down.


 (513) 984-1212
 (513) 984-1212