Math is its own kind of language, isn’t it? Instead of words alone, it uses numbers and symbols. But just like with any language, sometimes we need a quick translation to get the full idea.
“At least” and “at most” are among the math phrases that are easy to confuse, yet they come up regularly in middle and high school math.
We run into these phrases anywhere a problem describes a limit, such as an age requirement, a weight limit, or a minimum number of items. If we know how to translate them into symbols, we can turn the words into an inequality and start solving.
So, let’s find out what “at least” and “at most” mean, how to write them with inequality symbols, how they appear on a number line and in word problems, and how to remember which symbol goes with each phrase.
What Does the “At Least” Symbol Mean?
“At least” means a value that is equal to or greater than a certain number. It sets a minimum, so anything above that minimum also works. We write it as ≥. You may have also heard the phrase “no fewer than,” which means the same thing ≥.
For example, “at least 5” or “≥ 5” includes 5 and all values greater than 5.
Think about a sign that says, “You must be at least 21 to rent a car.” That means you can be 21 or older, but not younger than 21.
How Is the “At Least” Sign Different From a “More” Sign?
The main difference between “at least” and “more than” is whether we include the boundary number, the number where the condition starts or stops:
Say a roller coaster requires riders to be “at least 48 inches tall.” Your friend is exactly 48 inches tall, not an inch higher or lower. According to the sign, they can ride. But if the sign instead said “more than 48 inches,” your friend would be turned away.
Let’s see what the difference looks like in inequalities:
-
In x ≥ 5, we can include 5.
-
In x > 5, we have to start with numbers greater than 5, so 5 itself does not count.
How to Show “At Least” on a Number Line
To graph “at least,” we follow these steps:
-
Draw a number line and find the boundary number.
-
Use a closed (filled-in) circle at the boundary number to show that it is included.
-
Shade the line to the right of the boundary number, extending toward larger numbers, to show every value that meets the condition.
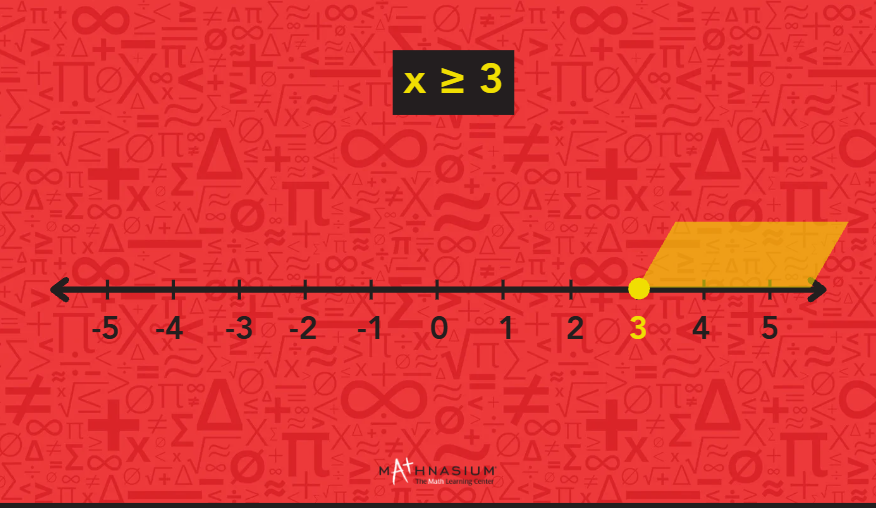
At Mathnasium, we prefer to use examples to make each step clear. So, we’ll apply these steps to x ≥ 3:
-
Draw a number line and find the boundary number. Here, the boundary number is 3, so we locate 3 on the number line.
-
Draw a closed circle at 3. We fill in the circle because 3 is included in x ≥ 3.
-
Shade to the right. The numbers greater than 3 are to the right, so we shade in that direction to include 3 and every number greater than 3.
Using “At Least” Sign in Word Problems
Now, we’ll put the “at least” symbol into practice with a word problem:
“A movie theater is showing a film rated for guests age 6 and older. Maya is planning to go with her friends. What ages can watch the movie, and how can we represent those ages with an inequality?”
We’ll use “a” to represent a guest’s age. The phrase “at least 6” means 6 is allowed, and so is any age greater than 6. That gives us the inequality a ≥ 6.
Let’s also graph our inequality:
-
Find 6 on the number line. This is our boundary number.
-
Draw a closed circle at 6. We fill in the circle because a 6-year-old is allowed to watch this movie.
-
Shade to the right. Ages greater than 6 are also allowed, so the shading continues toward larger numbers.
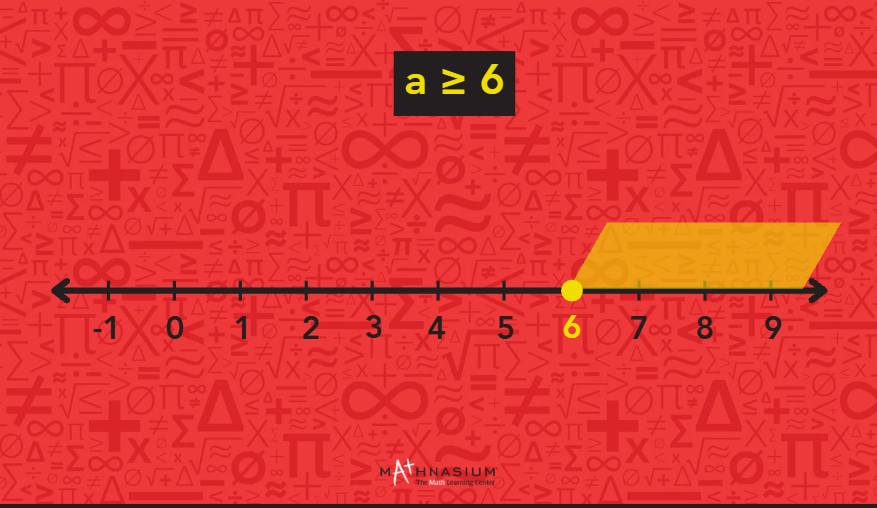
So, anyone 6 years old or older can watch the movie.
What Does the “At Most” Symbol Mean?
“At most” means a value that’s equal to or less than a certain number. In other words, the number gives us a maximum we cannot go above. You may also see “no more than,” which tells us the same thing. We write “at most” with the symbol ≤.
If we see “at most 8," "no more than 8”, or “≤ 8,” this means we include 8 and all values less than 8.
Picture an elevator with a sign that says, “This elevator can hold at most 10 people.” Ten people can ride, but adding an 11th person would go over the limit.
How to Show “At Most” on a Number Line
To graph “at most,” we need to:
-
Draw a number line and find the boundary number.
-
Use a closed (filled-in) circle at the boundary number to show that it is included.
-
Shade the line to the left of the boundary number, extending toward smaller numbers.
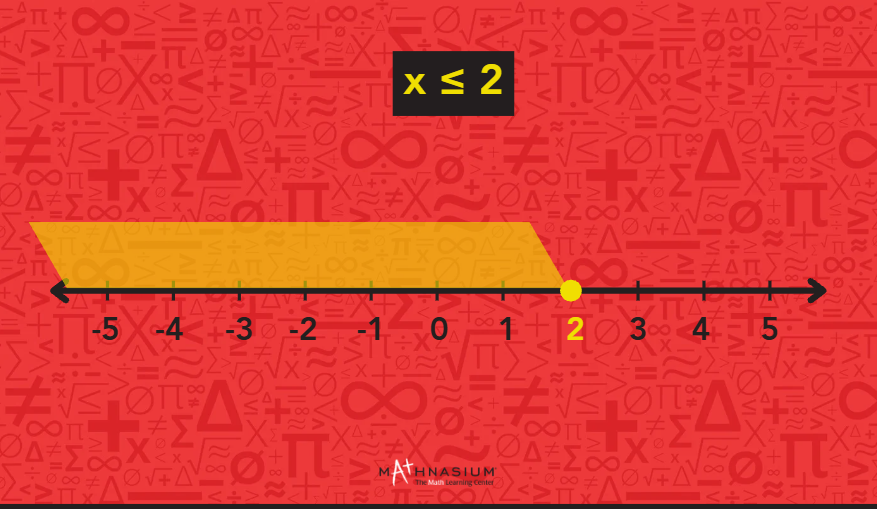
How about graphing this inequality step by step: x ≤ 2?
-
Draw a number line and find the boundary number. In our example, the boundary number equals 2. It’s the largest number we can include.
-
Draw a closed circle at the boundary number. We mark 2 with a closed circle. The filled-in circle tells us that 2 itself is part of the solution.
-
Shade the line to the left. Numbers get smaller as we move left, so we shade in that direction to include 2 and every number less than 2.
📕 You May Also Like: How Number Lines Improve Math Understanding (Grades 1-5)
How Is the “At Most” Sign Different From a “Less Than” Sign?
“At most” (≤) and “less than” (<) point in the same direction, but they do not include exactly the same values:
-
With “at most,” the boundary number still counts.
-
With “less than,” we have to stay strictly below the boundary number.
Suppose your backpack can weigh at most 15 pounds. You pack 12 pounds of books and a 3-pound laptop, bringing the total to exactly 15 pounds. That still meets the limit.
But if the rule says less than 15 pounds, you would need to remove something because 15 pounds would be too heavy and could put too much strain on the backpack.
With inequalities, we can see the difference right away:
Using the “At Most” Sign in Word Problems
To see how to use the “at most” symbol in word problems, we’ll work through this example: “The temperature in a freezer should be at most 0°F to keep food safely frozen. What temperatures meet this requirement?”
We’ll use t for the temperature in degrees Fahrenheit. Since 0°F is the highest allowed temperature, we write:
t ≤ 0
This includes 0°F and every temperature below 0°F, such as −5°F, −10°F, or −15°F.
We can also show the solution on a number line:
-
Locate 0 on the number line. This is the temperature limit in our problem.
-
Draw a closed circle at 0. We use a filled-in circle because 0°F still meets the requirement.
-
Shade to the left. Temperatures decrease as we move left, so the shaded part represents 0°F and every temperature below it.
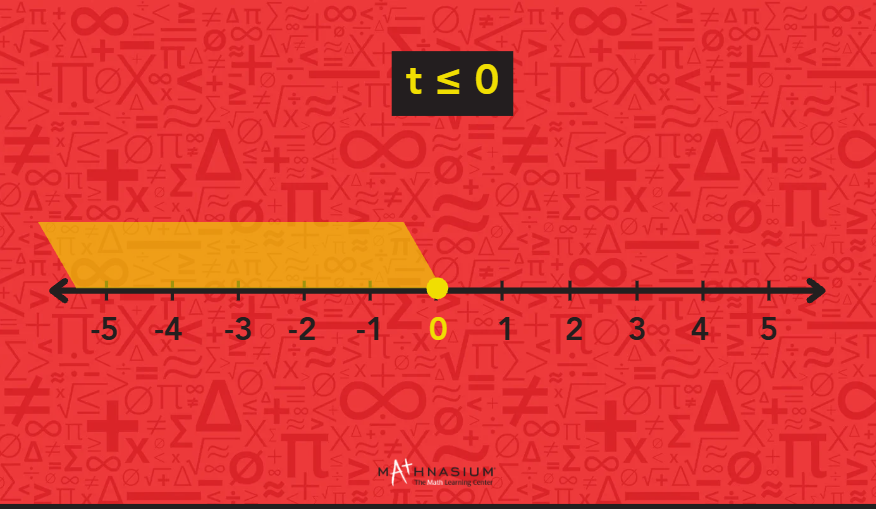
So, any temperature of 0°F or lower meets the requirement.
📕 You May Also Like: 7 Common Mistakes Students Make in Math Word Problems
How to Tell the “At Least” And “At Most” Signs Apart?
Both “at least” and “at most” symbols include their boundary number. The main difference between them is which way we go from the boundary number:
-
With “at least,” we include the boundary and move toward larger numbers.
-
With “at most,” we include it and move toward smaller numbers.
Quick Reference: “At Least” vs. “At Most”
If you still find it hard to tell them apart, take a look at this side-by-side comparison.
| Phrase |
Mathematical Meaning |
Symbol |
Real-World Example |
Inequality |
| At least, or no fewer than |
Minimum value (equal to or greater than) |
≥ |
“You must be at least 21 to rent a car.” |
a ≥ 21 |
| At most, or no more than |
Maximum value (equal to or less than) |
≤ |
“The elevator can hold at most 10 people.” |
x ≤ 10 |
Tips to Memorize the Symbols
In our work with students, we’ve noticed that “at least” and “at most” symbols can be easy to mix up at first. These memory tricks can help keep the signs straight.
A. The Alligator Method
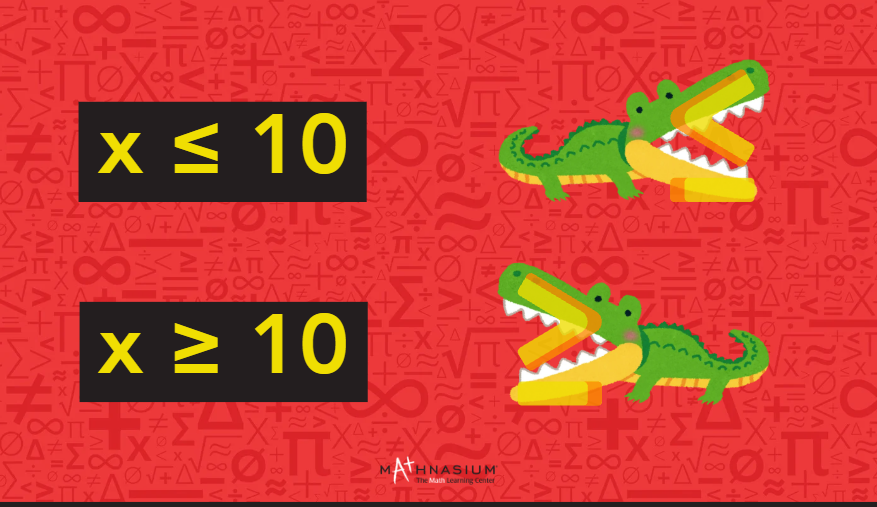
Imagine the symbol is the open mouth of a hungry alligator. The alligator always wants to eat the larger value.
-
In x ≤ 10, the mouth opens toward 10, so x must be less than or equal to 10.
-
In x ≥ 10, the mouth opens toward x, so x must be greater than or equal to 10.
B. The “L” Rule
The less-than sign < can remind us of a slanted capital L. Think L for less than. From there, ≤ means less than or equal to, which matches “at most.”
Put the “At Least” And “At Most” Signs Into Practice
Try translating and graphing these two word problems on your own. And remember to feed those alligators the right way!
Problem 1
A school club needs at least 25 signatures to submit its petition. How many signatures should the club collect?
Problem 2
The temperature during a winter experiment must be at most 5°F. What temperatures satisfy the condition?
You can check your answers at the bottom of the page.
📕 You May Also Like: 5 Ways Math Practice Impacts Brain Development + Benefits
 Mathnasium is a math-only learning center dedicated to helping K–12 students of all skill levels excel in math.
How Mathnasium Helps Students Make Sense of Math Concepts
Mathnasium is a math-only learning center dedicated to helping K–12 students of all skill levels excel in math.
In our tutoring work, we help students build a true understanding of math concepts, which includes making sense of mathematical language.
To do that, we use the Mathnasium Method™, our proprietary teaching approach, which is designed to meet students where they are and guide them toward math mastery step by step.
Each student begins with a diagnostic assessment that helps us understand their current skill level, knowledge gaps, goals, and how they think and feel about math. Using these insights, we create a personalized learning plan focused on the skills the student needs most, whether that means reinforcing number sense, building fluency with inequalities, or preparing for more advanced algebra.
Our specially trained tutors follow the plan closely and provide live, face-to-face instruction in a caring and fun group environment.
They use mental, verbal, visual, tactile, and written techniques to help students connect words, symbols, number lines, and equations so math notation becomes easier to interpret.
Students also get room to think through problems before tutors step in. Our tutors guide them through a problem instead of simply giving the correct answer. This helps students build problem-solving skills, critical thinking, and greater independence in math.
Fun is part of the approach, too. Game-based activities, rewards, and consistent encouragement help students stay engaged as they practice interpreting math language and applying it in new contexts.
The results? True, measurable progress:
-
94% of parents report an improvement in their child's math skills and understanding
-
93% of parents report their child's improved attitude toward math after attending Mathnasium
-
90% of students saw an improvement in their school grades
With over 1,100 learning centers across North America, there is likely a Mathnasium close to you.
For families in and near Cerritos, Mathnasium of Cerritos brings that same approach close to home, with specially trained tutors who help students make sense of inequalities, math language, and the algebra skills that build from them.
Whether your child needs to reinforce foundational skills, keep up with current coursework, or get ahead, a free diagnostic assessment is a great place to start. Using what we learn, we create a personalized learning plan that helps your child master the skills they need next.
📅 Schedule a Free Assessment at Mathnasium of Cerritos
Not near Cerritos?
📍 Find a Mathnasium Learning Center Near You
Pssst...! Check Your Answers Here
Ready to see how you did? Here are the answers to the practice problems above.
Problem 1
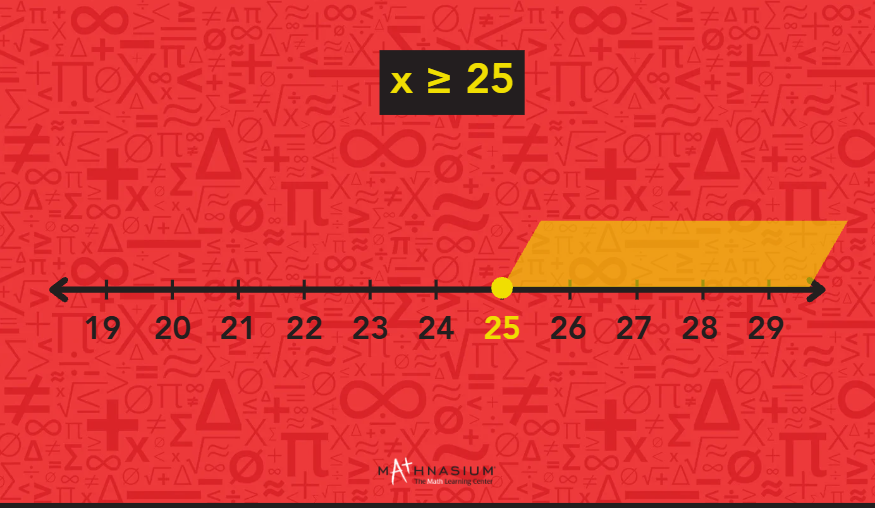
The club needs at least 25 signatures, so it can collect 25 or any number greater than 25. We can write it as an inequality:
x ≥ 25, where x is the number signatures
Problem 2
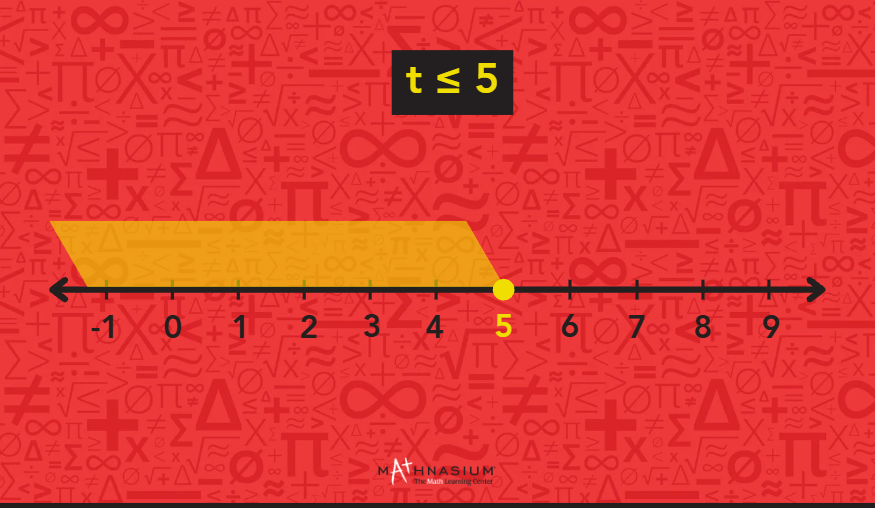
The temperature must be at most 5°F, so it can be 5°F or any temperature below 5°F. We’ll use t for temperature, and our inequality will look like this:
t ≤ 5


 (562) 653-9400
 (562) 418-8920