In math, letters like x and y stand in for numbers we don't know yet, or numbers that change. On a graph, y tells you how high or low a point sits, and x tells you how far left or right it sits.
The y-intercept is one of the first landmarks students learn to spot on a line, and it usually shows up as a simple number tucked into an equation like y = 2x + 5. Finding it is the easy part, but understanding why it matters and what it tells us about a line is where the real learning happens.
We help students understand concepts like these every day, so today we'll explain what a y-intercept is, how to spot it on a graph, how it shows up in an equation, and the common mistakes students make along the way.

What Is the Y-Intercept?
The y-intercept is the point where a line crosses the y-axis. It's the value of y when x equals 0.
Think of it as a starting point. If a line represents your savings account balance over time, the y-intercept is what you started with before you saved a single extra dollar.
Picture a graph. Right in the center is the origin, the point where the horizontal and vertical lines cross. That's where you always start plotting.
Let's say we want to plot the point (0, 3). The first number tells us how far to move left or right. Since it's 0, we stay put. The second number tells us how far to move up or down. Since it's positive 3, we move straight up 3 steps.
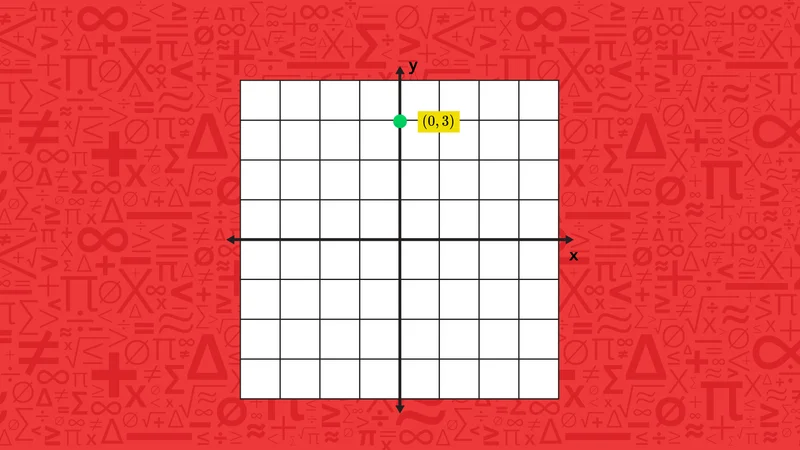
Stop there. That's our point, and it lands right on the vertical line running through the center. Any point that lands on that line is a y-intercept, because that's where the line "intercepts," or touches, the y-axis.
Once we can spot a y-intercept on a graph, the next step is recognizing it inside an equation.
📕 You May Also Like: What Is a Slope in Math? A Complete, Kid-Friendly Guide
What Is the Slope-Intercept Formula?
In algebra, a straight line can be written as an equation in the form y = mx + b. In this equation, the y-intercept is always the value of b.
This form has a name, slope-intercept form, but it's really just a shorthand for describing a line. The m controls how steep the line is and which way it tilts as x changes, while b marks where the line starts. B marks the starting height before the slope moves the line up or down.
Here's why b is always the y-intercept: plug in x = 0, and every term with an x in it disappears, since anything multiplied by 0 is 0. That leaves y = b, plain and simple.
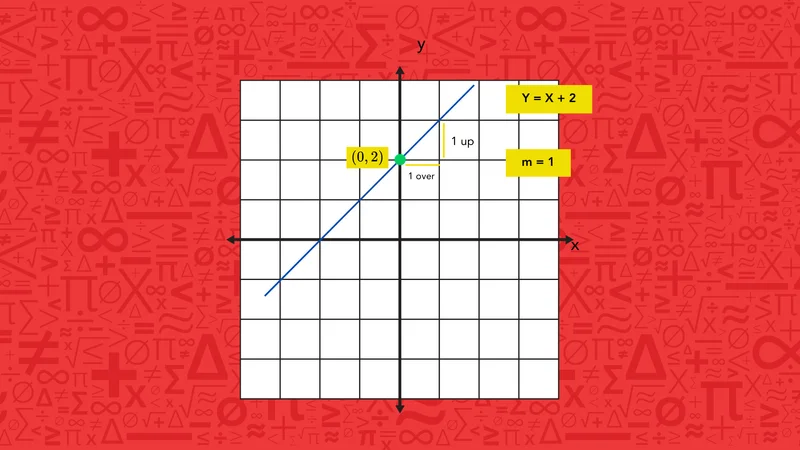
Say a phone plan charges a flat fee just to sign up, plus a set amount per gigabyte of data used. If the equation for the plan is y = 10x + 25, the 25 is y-intercept. That's the flat fee owed even if we use zero data, which is exactly what the y-intercept represents: the value of y when x is 0.
The 10 is the slope. It tells us how much the cost climbs for every gigabyte we add. But the y-intercept, that 25, is our starting line. It's what the graph shows before anything else changes.
Be careful, because not every equation shows up looking this clean. Something like 2y = 4x + 6 needs to be rearranged first. In cases like these, we can divide everything by their greatest common factor, which in this case is 2, and it becomes y = 2x + 3, at which point the y-intercept is easy to spot – it’s (0, 3)!
Finding that number is a skill on its own, but understanding what it actually represents is where graphing starts to click.
📕 You May Also Like: How to Convert Slope-Intercept Form to Standard Form
How to Find Y-Intercept on a Graph
Let's keep going with the same two lines from before.
Picture two lines:
y = 2x + 1
y = 2x + 4
Both climb at the exact same rate, since m (the number next to x) is 2 in both. A bigger m makes a line climb steeply, like a ladder standing straight up; a smaller m makes it climb slowly, like a ramp. Here, both lines climb at the same pace.
The first line starts at (0, 1), and the second starts at (0, 4), so the second line sits three spaces higher the whole way across the graph.
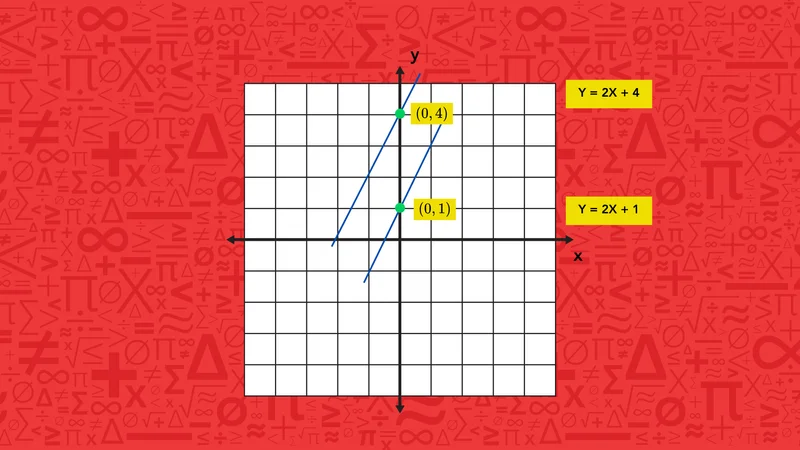
Think of it like two people walking up two different staircases that are built exactly the same way, same size steps, same steepness, except one person started three steps higher than the other before they even began climbing them.
Because of that, the two lines never touch, and they never get closer together or farther apart. That's what it means for lines to be parallel – they point in the same direction, at the same angle, forever, without ever crossing.
Once a student can see that, the y-intercept stops being just a coordinate to identify and starts being something they can picture: the line's starting height before its slope takes over.
📕 You May Also Like: Positive vs. Negative Slope — What’s the Difference?
Common Mistakes Students Make with the Y-Intercept
The most common y-intercept mistake is mixing it up with the x-intercept.
Here's the quick fix: the y-intercept crosses the y-axis, where x = 0. The x-intercept crosses the x-axis, where y = 0.
Same idea, opposite axis, and it's an easy pair to swap when working quickly.
-
Forgetting that x is always 0. When students check their work, they sometimes plug in the wrong value and end up confirming an incorrect answer. A quick habit fixes this: before finalizing the y-intercept, confirm x = 0 was used, not 1, not –1, just 0.
-
Assuming the y-intercept is always positive. Plenty of students expect a "normal" looking number and get thrown off by something like y = –3x – 2, where the y-intercept is (0, –2). A line can cross the y-axis above or below the x-axis, and both are equally valid.
-
Grabbing the wrong number when the equation isn't in slope-intercept form. An equation like 3y = 6x + 9 doesn't show the y-intercept until it's rearranged into y = 2x + 3. Students who skip that step often circle the wrong number entirely.
Each of these mix-ups comes from the same root cause: rushing past the setup. Slowing down to confirm x = 0 and the equation's form solves most of them before they happen.
📕 You May Also Like: How to Use T-Charts to Solve (and Graph) Linear Equations

At Mathnasium, our specially trained tutors help students understand what the y-intercept represents, not just how to identify it, so they can graph linear equations with confidence.
How Mathnasium Help Student Learn Graphic Concepts
Mathnasium is a math-only learning center dedicated to helping K–12 students of all skill levels excel in math. Whether students are learning what the y-intercept represents, practicing how to identify it in equations and graphs, or exploring how it relates to the slope of a line, we can help.
Our proprietary teaching approach, the Mathnasium Method™, is designed around each student's needs and learning style. To help students build a deep understanding of linear equations and graphing concepts, our approach includes:
-
Assessment and Personalized Learning Plans: Each student starts with a diagnostic assessment that identifies current skills, strengths, and gaps. From those findings, we build a personalized learning plan tailored to their goals, whether that means strengthening foundational angle concepts, improving algebraic problem-solving, or preparing for more advanced geometry.
-
Teaching for Understanding: Our specially trained tutors use natural language and a mix of verbal, visual, mental, tactile, and written techniques so each concept lands before we move forward.
-
Problem-Solving and Critical Thinking: We allow time for students to work through problems on their own. That productive struggle helps them learn to trust their own reasoning. When we do step in, we explain both the how and the why behind each answer, so students build problem-solving and critical thinking skills they can use in math and beyond.
-
An Engaging and Fun Learning Environment: Sessions include games, earned rewards, and consistent celebration of progress. Students build confidence alongside stronger math skills, and many develop a more positive relationship with math over time.
Our students' results reflect what personalized instruction can do:
-
94% of parents report improvement in their child's math skills and understanding
-
93% of parents report an improved attitude toward math after attending Mathnasium
-
90% of students saw improvement in their school grades
With over 1,100 learning centers across North America, there is likely a Mathnasium close to you.
Families across St. George and nearby areas, including Washington, Santa Clara, Ivins, and Hurricane, trust Mathnasium of St. George to help their children build lasting math confidence at every level.
If the y-intercept, slope, or any other graphing concept is giving your child trouble, our team is ready to help.
📅 Schedule a Free Assessment at Mathnasium of St. George
Not near St. George?
📍 Find a Mathnasium Learning Center Near You


 (435) 767-0335
 (435) 767-0335