Students usually meet proportional relationships around the same time they start working with linear equations, so it’s easy for the two ideas to blur together. Both describe how two quantities change, and both can produce straight-line graphs.
But we need to be able to tell them apart because both ideas come up again in later math as we move into slope, graphing, and linear functions.
So, let’s figure out together what makes a relationship proportional, what a linear equation is, and how to recognize each one.

What Is a Proportional Relationship?
A proportional relationship is a relationship where two quantities always grow by the same constant ratio. If one value doubles, the other doubles too, and if one value is zero, the other is always zero as well.
Let’s make that concrete. Imagine you buy apples for $2 per pound. If you buy 1 pound, you will pay $2. If you buy 2 pounds, you will pay $4. If you buy 3 pounds, you’ll pay $6. The cost is always twice the number of pounds.
We can write that as: cost = 2 × pounds.
If we use y for the total cost and x for the number of pounds of apples, we can write the equation as:
y = 2x
The number 2 tells us how the two quantities are connected. We call it the constant of proportionality, and we usually write it as k.
So proportional relationships follow this general form:
y = kx

How Does a Proportional Relationship Look on a Graph?
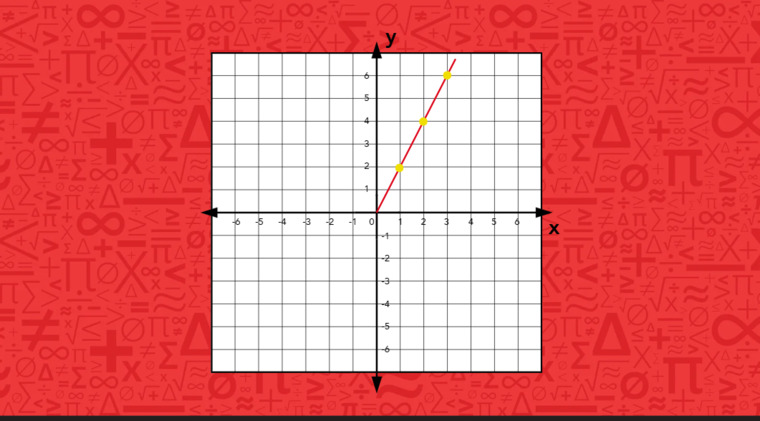
Let’s plot this relationship, y = 2x, step by step on a graph. Apples cost $2 per pound, so the total cost depends on how many pounds we buy with x standing for pounds and y for total cost.
-
Step 1: Find a few pairs of values. To find points for the graph, we substitute different values for x into the equation y = 2x and calculate y. If x = 0, the cost is $0. For 1 pound, the cost is $2; for 2 pounds, it’s $4; and for 3 pounds, it’s $6.
-
Step 2: Write each pair as a point. On the graph, we’ll use x for the number of pounds, y for the total cost. So our values become (0,0), (1,2), (2,4), (3,6). For example, (2,4) means that 2 pounds of apples cost $4.
-
Step 3: Plot the points. We place each point on the coordinate plane, using the horizontal axis for pounds and the vertical axis for cost.
-
Step 4: Draw a line through the points. The points line up in a straight line. That line represents the equation: y = 2x. Because the number of pounds cannot be negative, we draw the graph starting at the origin and continuing through the first quadrant.
📕 You May Also Like: How to Solve Proportions: Four Methods and When to Use Each
What Is a Linear Relationship?
A linear relationship is a broader version of proportional relationships. The two quantities still change in a consistent way, but the relationship does not have to start at zero.
To make the concept clearer, we’ll ground it with an example. Say you take a taxi ride that charges a $3 starting fee, plus $2 for every mile you travel.
We can write that as: cost = 2 × miles + 3
We may also use x for the number of miles and y for the total cost, so the equation will look like this:
y = 2x + 3
Linear relationships like this can be written in the general form:
y = mx + b
Here, m tells us the constant rate of change, while b tells us the starting value when x = 0. In the taxi example, b = 3.
How Does a Linear Relationship Look on a Graph?
Now, we’ll build a graph for our taxi example: y = 2x + 3.
X is the number of miles traveled, and y is the total cost.
-
Step 1: Start with the value when x = 0. Before we travel any miles, the taxi already charges $3. So when x = 0, y =(20)+3=3. Our first point is: (0,3).
-
Step 2: Find a few more pairs of values. We substitute a few more values for x into the equation. For 1 mile (x = 1), the cost is y =2 1+3=5. So we get the point (1,5). For 2 miles (x=2): y =2 2 +3=7. So, we get another point, (2,7).
-
Step 3: Plot the points. We place (0,3), (1,5), and (2,7) on the coordinate plane. Each time we move 1 unit to the right, the y-value increases by 2.
-
Step 4: Draw a line through the points. The points lie on a straight line, so we draw a line through them. This line crosses the y-axis at (0,3) because of the $ 3 fee. The point (0,3) is the y-intercept, which shows the starting value in the equation.
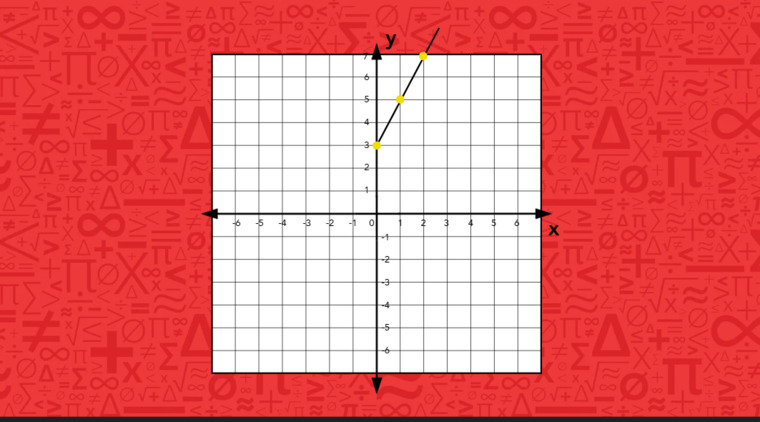
Because x represents miles traveled, we only use x ≥ 0. Negative miles do not make sense in this situation, so we do not extend the line into the second or third quadrant.
📕 You May Also Like: Functions vs. Equations: What Is the Difference?
How Is a Proportional Relationship Different From a Linear One?
Every proportional relationship is technically a linear relationship, but not every linear relationship is proportional. The difference comes down to whether the relationship has a starting value other than 0.
Let’s see what that difference looks like in a real-world example. Take two bike rental services with different pricing.
Bike Rental A has no starting fee. You simply pay $6 per hour.
We can write the relationship as:
cost = 6 × hours,
or y = 6x, where y is the total cost and x is the number of hours.
Now, we’ll look at how this appears on a graph.
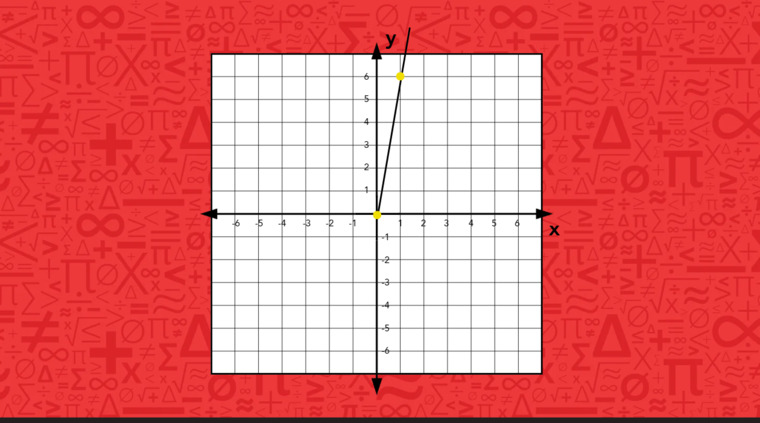
We don’t continue the line into the third quadrant because a negative number of hours on a bike isn't possible. Since there is no starting fee, the graph begins at the origin, (0,0): 0 hours cost $0.
The total cost increases by $6 for each hour, and when the number of hours is 0, the cost is also 0. So Bike Rental A’s pricing is a proportional relationship.
Bike Rental B charges a $3 unlock fee, plus $2 per hour.
This relationship looks like this: cost = 2 × hours + 3,
or y = 2x + 3, where y is total cost and x is the number of hours.
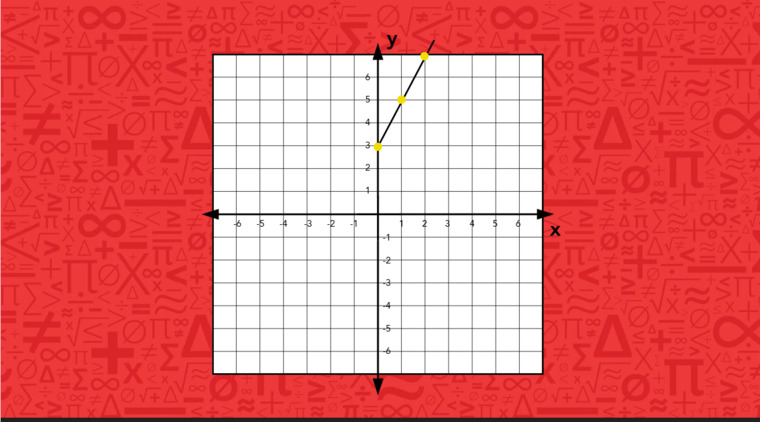
Again, we only use non-negative values of x because we cannot ride a bike for a negative number of hours. This time, the graph starts at (0,3) rather than the origin. Even before the first hour, we already need to pay the $3 unlock fee. The total cost then increases by $2 for each hour.
So Bike Rental B’s pricing is linear, but it is not proportional because when x = 0, y = 3 rather than 0.
Now let’s compare the two examples side by side:
|
Bike Rental A (Proportional) |
Bike Rental B (Linear) |
| Ratio of costs to hours |
Stays constant at $6 per hour |
Changes because the $3 starting fee is included in the total cost |
| Graph |
Passes through the origin |
Does not pass through the origin |
| Y-intercept |
0 |
3 |
📕 You May Also Like: 6 Ways to Help Your Child Understand Proportionality
Quick Reference: What Is the Difference Between a Proportional Relationship and a Linear One?
To help you keep the main differences between proportional and linear relationships straight, our tutors put the two concepts side by side. Use this table as a quick reference.
|
Proportional |
Linear (General) |
| Equation format |
y = kx |
y = mx + b |
| Y-intercept |
Always 0 |
Can be any number |
| Graph |
Always passes through the origin |
May or may not pass through the origin |
| How the two concepts relate |
A proportional relationship is a special type of linear relationship where b = 0. |
A linear relationship is the broader category and can include proportional relationships. |
Proportional or Linear Relationship?
For each problem below, decide whether it’s proportional or linear. You can check your answers at the bottom of the page.
-
A parking garage charges $2 for every hour, with no entry fee.
-
A phone plan costs $20 per month plus $0.10 per text.
-
A recipe uses 3 cups of flour for every 2 cups of sugar.
📕 You May Also Like: Why Math Practice Matters & What Happens When Kids Skip It
 Mathnasium is a math-only learning center dedicated to helping K–12 students of all skill levels excel in math.
How Mathnasium Helps Students With Proportional And Linear Relationships (and Beyond)
Mathnasium is a math-only learning center dedicated to helping K–12 students of all skill levels excel in math.
Whether a student is comparing proportional and linear relationships, working with rates, or preparing for more advanced algebra, our tutors help them understand what the relationship means instead of simply plugging numbers into a formula.
To reach that understanding, we use the Mathnasium Method™, our proprietary teaching approach, designed around each student’s needs.
Here is how it works.
Each student begins with a diagnostic assessment that helps us understand which skills are secure, which need more support, and how the learner thinks and feels about math.
Using these insights, we create a personalized learning plan focused on the skills the student needs most, whether that means reinforcing ratio and rate concepts, connecting equations to graphs, or preparing for more advanced work with linear relationships.
Our specially trained tutors follow the plan closely and provide live, face-to-face instruction in a caring and fun group environment. They use mental, verbal, visual, tactile, and written techniques to help students understand graphs, equations, and real-world situations so the math concepts, like proportional and linear relationships make sense.
Students also get room to think through problems before tutors step in. This helps students build problem-solving skills, critical thinking, and greater independence in math.
Fun is an important part of the approach, too. We use game-based activities, rewards, and consistent encouragement to help students stay engaged as they work with patterns, rates, and relationships.
The impact is clear in our results:
-
94% of parents report an improvement in their child's math skills and understanding
-
93% of parents report their child's improved attitude toward math after attending Mathnasium
-
90% of students saw an improvement in their school grades
With over 1,100 learning centers across North America, there is likely a Mathnasium close to you.
For families in and near St. George, Mathnasium of St. George brings that same approach close to home, with specially trained tutors helping students build true understanding of proportional relationships and the algebra skills that build from them.
Whether your child needs support with algebra foundations, struggles to keep up with current coursework, or is ready to get ahead, a free diagnostic assessment is a great place to start. Using what we learn, we create a personalized learning plan that helps your child master the skills they need next.
📅 Schedule a Free Assessment at Mathnasium of St. George
Not near St. George?
📍 Find a Mathnasium Learning Center Near You
Pssst! Check Your Answers Here
Ready to see how you did? Here are the answers for the practice problems above:
| Problem |
Proportional or Linear |
Reason |
| Parking garage |
Proportional |
No fee before the hourly rate; $0 at 0 hours |
| Phone plan |
Linear (not proportional) |
The $20 monthly cost exists even with 0 texts. |
| Recipe |
Proportional |
The ratio of flour to sugar (3:2) stays constant no matter how much is made. |


 (435) 767-0335
 (435) 767-0335