You've probably already worked with bar graphs, line plots, and other charts that help us organize data. These tools are useful when we want to spot a pattern or compare values quickly.
But sometimes we need to see every value in a data set and still get a sense of how the data is spread out. That is where a stem-and-leaf plot can help.
Stem-and-leaf plots organize a list of numbers by splitting each value into two parts: a stem and a leaf. This lets us see every original number while also noticing the overall shape of the data.
Today, we're going to break down what a stem-and-leaf plot is and how to read and build one.

What Is a Stem-and-Leaf Plot?
A stem-and-leaf plot is a data display that organizes a list of numbers by splitting each value into a stem and a leaf:
-
The stem: the first digit (or digits) of a number, listed once down the left side.
-
The leaf: the last digit of a number, listed next to its matching stem.
This lets us see the original numbers while also noticing how the data is grouped.
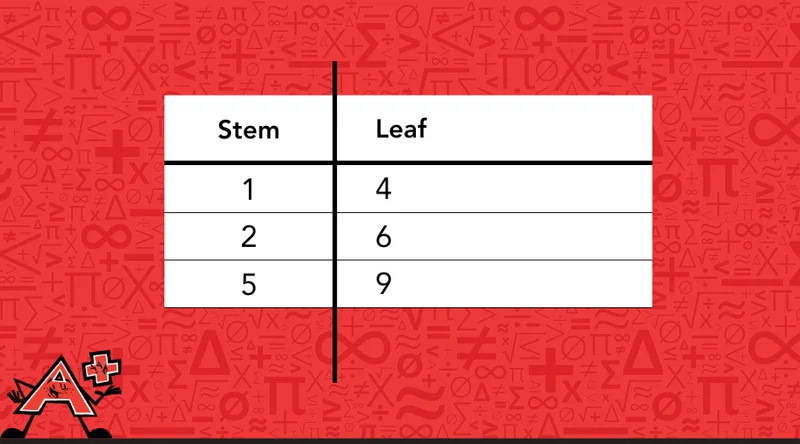
Let's see this with three simple numbers: 14, 26, and 59. For 14, the stem is 1 and the leaf is 4. For 26, the stem is 2 and the leaf is 6. For 59, the stem is 5 and the leaf is 9.
📕 You May Also Like: Tens and Ones: How to Build the Foundation of Place Value
How to Read a Stem-and-Leaf Plot
To read a stem-and-leaf plot, we combine each stem with each of its leaves to get back the original numbers, one at a time.
Imagine your class is running a fundraiser, and each day for two weeks, you count up how many raffle tickets got sold. By the end, your teacher hands you a stem-and-leaf plot summarizing the two weeks of sales and asks you to figure out how the fundraiser went.
Let's read the plot together and see what it can tell us.
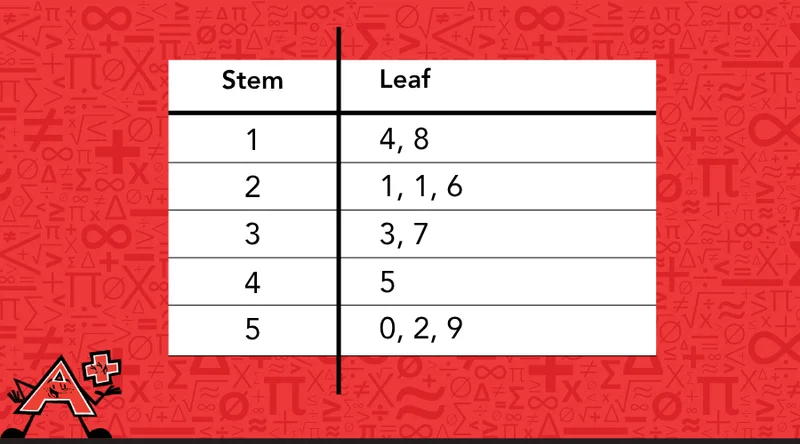
Step 1: Pick a Stem, Read Across to See All the Leaves That Belong to It
The plot has five stems, and we'd read each one the same way. Let's start with stem 2 as an example. Reading across, we see three leaves: 1, 1, and 6.
Step 2: Find Each Original Number of the Stem
We combine the stem with each leaf, one at a time. Stem 2 with leaf 1 gives us 21, and as that leaf shows up twice, we know two days had exactly 21 tickets sold. Stem 2 with leaf 6 gives us a third day with 26 tickets sold.
For stem 2, our numbers are 21, 21, and 26. We'd repeat this same process for stems 1, 3, 4, and 5 to read out every value in the data set.
Step 3: Use the Full Set of Numbers to Answer Questions About Data
When we read individual numbers back out of the plot, we can use the whole data set to answer bigger questions about it.
A. Find the Smallest (and the Largest) Value
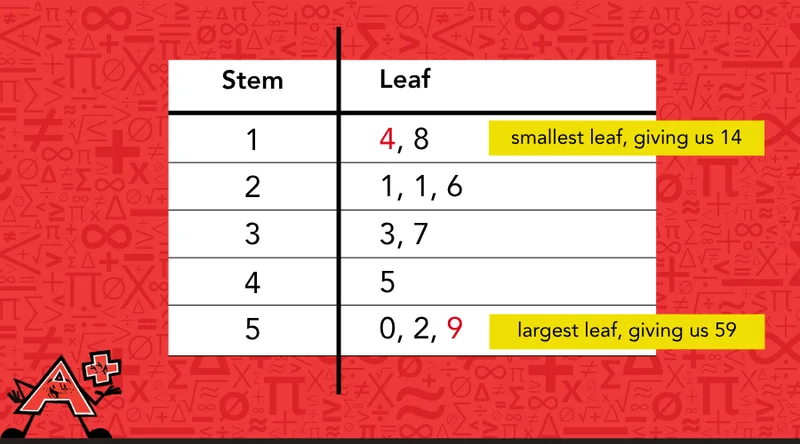
To find the smallest value, we need to look at the very first stem with the smallest leaf. In our example, that's stem 1 with leaf 4, giving us 14, so the slowest day brought in 14 tickets.
The largest value sits at the very last stem with its largest leaf. Here, that's stem 5 with leaf 9, giving us 59. So the best day brought in 59 tickets.
B. How Many Values Fall Within a Certain Range
Say you want to know how many days had ticket sales in the 20s, meaning between 20 and 29 tickets sold that day. Check the leaves next to stem 2: there are three leaves, 1, 1, and 6, which give us 21, 21, and 26. That means three days had ticket sales somewhere in the 20s.
📕 You May Also Like: How to Compare Numbers Using Place Value
How to Build a Stem-and-Leaf Plot
To build a stem-and-leaf plot, we sort a list of numbers, split each one into a stem and a leaf, and organize the leaves next to their matching stem.
Now, we'll work through the steps with this example.
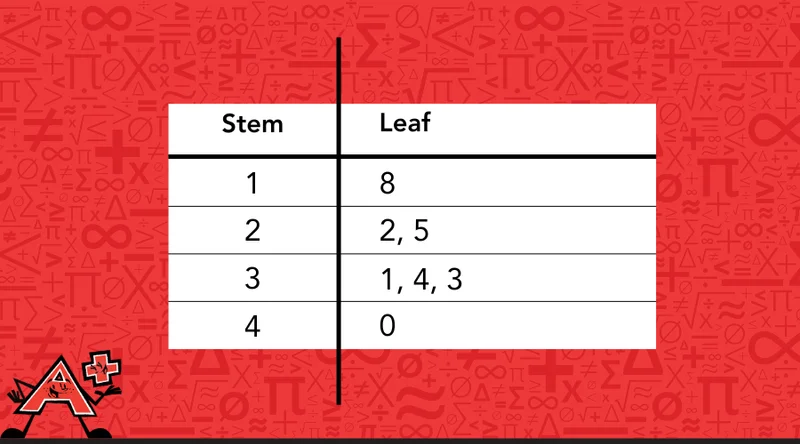
Say you and your friends just finished a round of mini-golf, and instead of comparing scores one at a time, you decide to write them all down so you can see how everyone did. You jot down the scores as your friends call them out: 31, 18, 40, 22, 34, 25, 33.
We’ll build a stem-and-leaf plot from that list and see what it can tell us.
Step 1: List the Possible Stems in Order
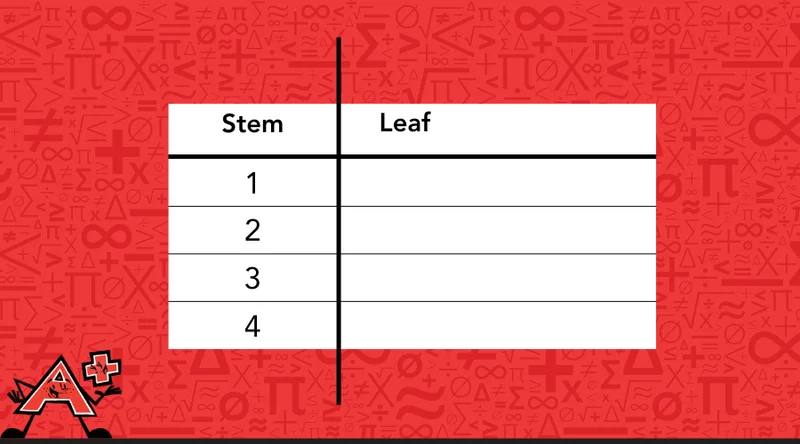
Looking at the tens digit of each number in our data set, we can see our stems will be 1, 2, 3, and 4. We list them in order, from smallest to largest, down the left side of our plot.
Step 2: Write Each Leaf Next to Its Matching Stem
Now we go through the data one number at a time, writing each one's last digit next to its matching stem:
-
31 gives us a leaf of 1 next to stem 3.
-
18 gives us a leaf of 8 next to stem 1.
-
40 gives us a leaf of 0 next to stem 4.
-
22 gives us a leaf of 2 next to stem 2.
-
34 gives us a leaf of 4 next to stem 3.
-
25 gives us a leaf of 5 next to stem 2.
-
33 gives us a leaf of 3 next to stem 3.
Step 3: Arrange the Leaves Next to Each Stem From Smallest to Largest
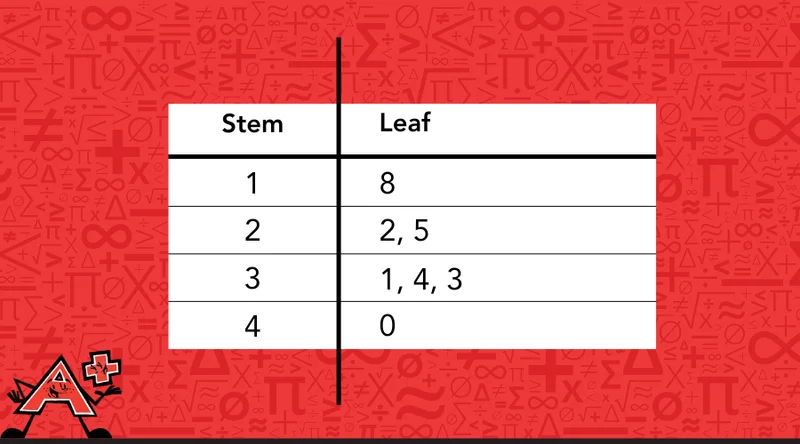
Finally, we double-check that the leaves next to each stem run from smallest to largest, so the finished plot is easy to scan at a glance.
In our example, stem 3 picked up its leaves out of order, 1, 4, 3, so we rearrange them to 1, 3, 4. The other stems only have one or two leaves already in order, so nothing else needs to change.
Try Reading a Stem-and-Leaf Plot Yourself
Now it's your turn to put these steps to work. Below is a stem-and-leaf plot showing the number of minutes a group of students spent reading over the weekend.
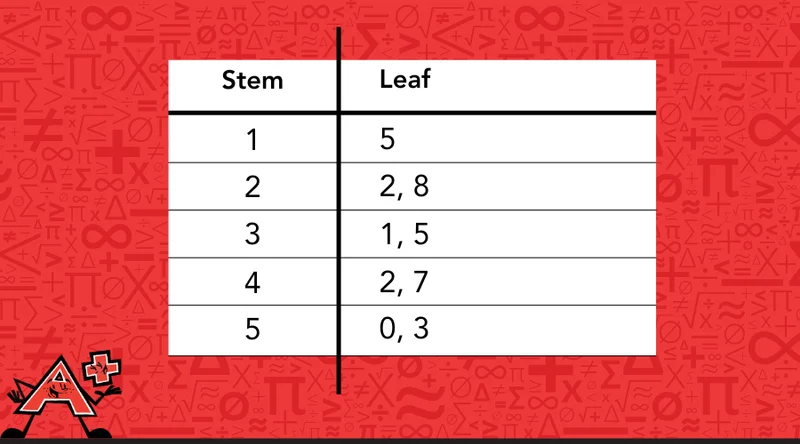
Problem: Identify the smallest number of minutes read, the largest number of minutes read, and how many students read for more than 30 minutes. Check your answers at the bottom of the page.
📕 You May Also Like: How to Build a Math Practice Routine That Lasts

At Mathnasium, tutors guide students through stem-and-leaf plots step by step, helping them use place value and number order to see what the data is telling them.
How Mathnasium Helps Students Build Data Literacy (and Beyond)
Mathnasium is a math-only learning center dedicated to helping K–12 students of all skill levels excel in math.
We help students build a true understanding of math concepts like stem-and-leaf plots through clear explanations and step-by-step reasoning.
To build that understanding, we use the Mathnasium Method™, our proprietary teaching approach, to meet students where they are and guide them toward math mastery, step by step.
Each student begins their Mathnasium journey with a diagnostic assessment, which helps us identify their current skills, knowledge gaps, and how they think about math, including the number sense, place value, and data literacy skills behind reading and creating stem-and-leaf plots.
From there, we create a personalized learning plan focused on the skills the student needs most, whether that means focusing on place value, organizing data, reading graphs and displays, comparing values, or preparing for statistics and more advanced data analysis.
Our specially trained tutors follow the plan closely, delivering face-to-face instruction in a caring and supportive environment, both in-center and online. We teach through a mix of visual, verbal, tactile, written, and mental techniques so each concept lands clearly.
For topics like stem-and-leaf plots, students may sort data, build a display, read values from a plot, compare clusters, notice gaps, or explain what the spread of the data tells them. This helps them understand data displays as tools for making sense of information rather than just formats to copy.
Our tutors also give students room to think through problems before stepping in. They guide students to explain their reasoning, check whether their answers match the data, and connect what they see in the plot to the original numbers. This balance helps students build problem-solving skills, critical thinking, and greater independence in math.
Fun is a core part of our approach, too. We use hands-on and game-based activities, rewards, and consistent encouragement to keep students engaged as they build confidence with numbers, data, and mathematical reasoning.
The impact is clear in the results:
-
94% of parents report improvement in their child’s math skills and understanding
-
93% of parents report a more positive attitude toward math after attending Mathnasium
-
90% of students saw improvement in their school grades
With over 1,100 learning centers across North America, there is likely a Mathnasium close to you.
For families in and near Suwanee, GA, Mathnasium of Suwanee brings that same approach close to home, with specially trained tutors helping students build data literacy and number sense.
If your child finds stem-and-leaf plots, data displays, or any part of statistics challenging, a free diagnostic assessment is a great place to start. Then, we’ll carve out a personalized learning plan that helps your child master the skills they need next.
📅 Schedule a Free Assessment at Mathnasium of Suwanee
Not near Suwanee?
📍 Find a Mathnasium Learning Center Near You
Pssst! Check Your Answers Here
Ready to see how you did? Let's walk through the reading-minutes problem together.
-
The smallest value is 15 minutes, found at stem 1 with leaf 5.
-
The largest value is 53 minutes, found at stem 5 with leaf 3.
-
6 students read for more than 30 minutes. To find that out, we look at every stem of 3 or higher. Stem 3 has leaves 1 and 5 (31 and 35), stem 4 has leaves 2 and 7 (42 and 47), and stem 5 has leaves 0 and 3 (50 and 53). So we have students who read for 31, 35, 42, 47, 50, and 53 minutes, six students in total.


 (770) 273-9697