A linear equation is one of the first big hurdles in algebra, but graphing it is much simpler than it looks. Whether you are helping your child with homework or trying to make sense of coordinate grids yourself, turning an equation into a straight line comes down to a few repeatable steps.
In this guide, our Mathnasium tutors explain what linear equations mean, how slope and coordinates work together, and how to plot any equation step by step using a simple table of values.

What Is a Linear Equation?
A linear equation is an algebraic equation where each variable has an exponent of 1, and its graph on a coordinate plane forms a straight line.
Let’s see how this works through a simple example. Say we start a hike already 3 miles in, and we take a little break, and then we decide to walk at a steady pace of 2 miles every hour.
-
After one hour, we're at 5 miles.
-
After two hours, we're at 7 miles.
-
After three hours, we're at 9 miles.
Because the distance increases by the exact same amount every hour, the connection between time and distance stays the same, which makes this a linear relationship.
We can write that same relationship as an equation, where:
-
y represents the total distance covered
-
x represents the number of hours we've been walking, and multiplying it by our rate of 2 miles per hour tells us how far we've traveled since we started
-
The 3 miles is where we started, before any walking hours are counted, and that makes it our constant
Together, those pieces give us:
y = 2x + 3
We call this the slope-intercept form, and it’s one of the three common forms a linear equation can take.
|
Form:
|
Equation:
|
Best For:
|
|
Slope-Intercept Form
|
y = mx + b (m is the slope, b is the y-intercept)
|
We know the slope and where the line crosses the y-axis.
|
|
Standard Form
|
Ax + By = C (A, B, and C are constants)
|
We want both variables on the same side, useful for comparing equations.
|
|
Point-Slope Form
|
y − y₁ = m(x − x₁)
|
We know the slope and one specific point on the line.
|
Note: In each of these forms, x and y carry an exponent of 1. A higher power on x, such as x², produces a curve instead of a straight line, making the equation nonlinear.

Important Properties of a Linear Equation Graph
The key properties of a linear equation graph are its slope and its x- and y-coordinates.
The slope determines how steeply the line rises or falls, and the x- and y-coordinates define the exact position of every point along the line. Together, these properties show us how the variables interact across the coordinate plane.
A. Slope
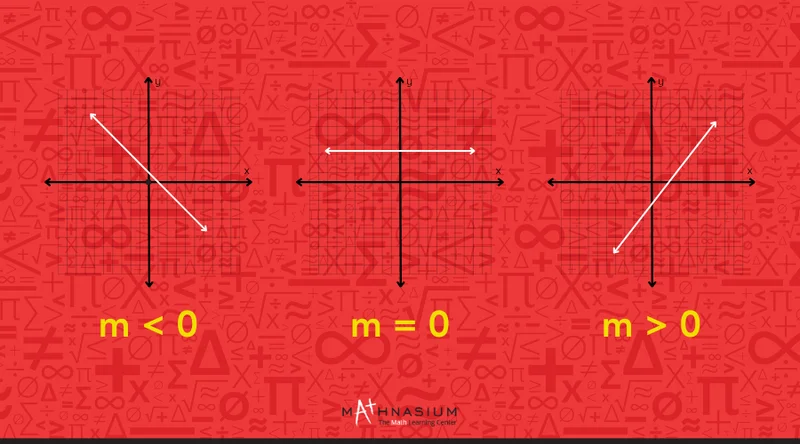
The slope tells us how steep a line is, and whether it climbs or falls. In y = mx + b, the slope is m, the number that multiplies x.
The value of m tells us how the line behaves:
-
Increasing if m > 0 (the line goes up)
-
Horizontal if m = 0 (the line is flat)
-
Decreasing if m < 0 (the line goes down)
If m = 0, the equation becomes y = 0x + b, which simplifies to y = b. With no rise built into the equation, the line stays flat at height b across the entire graph.
📕 You May Also Like: What Is a Slope in Math? A Complete, Kid-Friendly Guide
B. X and Y Coordinates
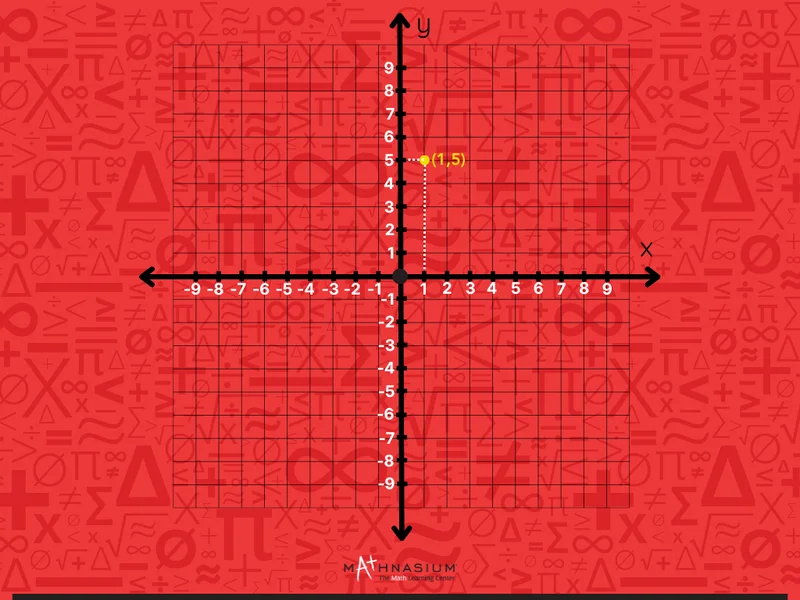
Every point on the coordinate plane is written as (x, y), with the x-coordinate first and the y-coordinate second.
In y = mx + b, x is the value we choose, and y is what the equation gives us back once we plug that x value in.
Every pair of x and y that satisfies the equation becomes one point (x, y) we can plot on the line.
Take our earlier equation, y = 2x + 3. If we choose x = 1, the equation gives us y = 2(1) + 3 = 5.
That places our point at (1, 5) on the coordinate plane.
And we can plot it on the graph like this:
-
For x = 1, we move 1 unit to the right of the origin along the x-axis
-
For y = 5, we move 5 units up from there along the y-axis
📕 You May Also Like: How the Coordinate Plane Works: A Guide for Parents And Students
How to Graph a Linear Equation Using a Table of Values
To graph a linear equation using a table of values, we choose a few x values, solve for the matching y value each time, and plot the resulting points.
Let’s put this into practice with y = -3x + 4.
Step 1: Choose a few values for x
Three values are usually enough, and it helps to include 0 as one of them. If x equals 0, the equation gives us the y-intercept directly, so that point is a useful anchor before we add the other two.
Let's choose x = -1, x = 0, and x = 1.
Step 2: Substitute each x value into the equation
We replace x in y = -3x + 4 with each value we chose, then solve for y.
Step 3: Record these as coordinate pairs in a table
Each x value and its matching y value form one point, written as (x, y). A table keeps all three pairs organized before we plot them.
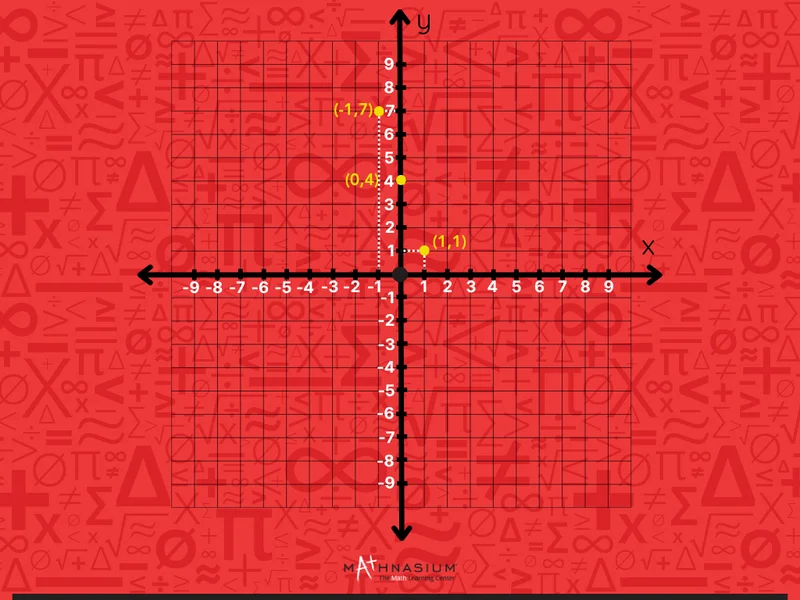
Step 4: Plot each pair on the coordinate plane
We locate every point by moving along the x-axis first, then up or down to match the y-coordinate.
-
For (-1, 7), we move 1 unit left of the origin, then 7 units up
-
For (0, 4), we stay at the origin on the x-axis, then move 4 units up
-
For (1, 1), we move 1 unit right of the origin, then 1 unit up
Step 5: Connect the coordinates
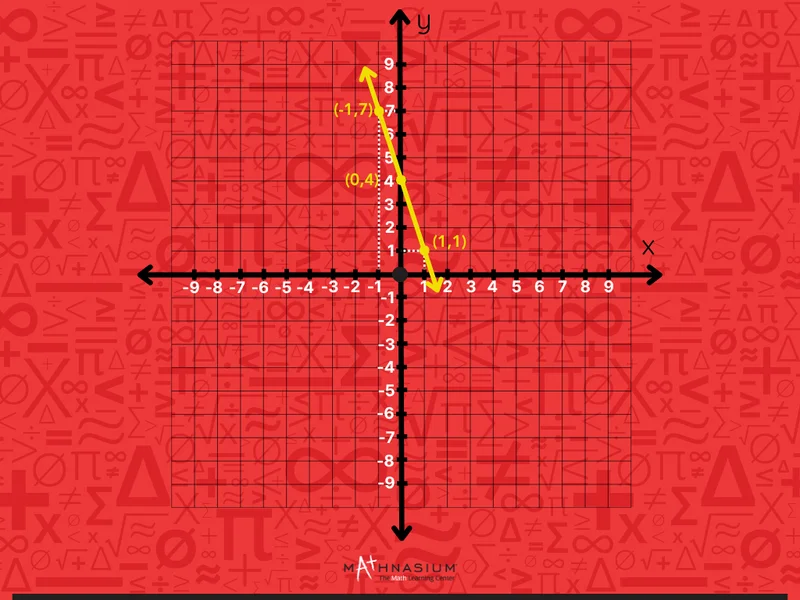
We draw a straight line through all three points, extending it in both directions with arrows on each end. Since all three points sit on the same line, this confirms that the equation is linear.
📕 You May Also Like: How to Prepare Your Student for Algebra: From Graphs to Variables
Your Turn: Graph These Linear Equations
Let's put the table of values method to work. For each equation, follow the same five steps we just covered to draw the line.
Take your time working through each one. Check your answers at the bottom of the guide.

A Mathnasium tutor helps a student build confidence in algebra, one concept at a time.
How Mathnasium Helps Students Master Algebra (And Beyond)
Mathnasium is a math-only learning center serving students, focused on building confident, independent math thinkers through personalized instruction and targeted support.
Students come to us at different points in their math journey. Some need extra support with core skills like plotting coordinates and reading a graph. Others are ready to work with slope and multiple equation forms at a more advanced level. Wherever a student is starting from, we build a path forward from that exact point.
We do this through the Mathnasium Method™, our proprietary teaching approach built around personalized learning and proven instructional techniques.
Here's what that looks like in practice:
-
Diagnostic Assessment and Personalized Learning Plans: Each student begins with a diagnostic assessment that identifies both visible skill gaps and the reasoning patterns behind them. From that starting point, we build a personalized learning plan tailored to their needs and goals, helping them build lasting math mastery at a pace that works for them.
-
Teaching for Understanding: Our specially trained tutors use plain, everyday language and a mix of verbal, visual, mental, tactile, and written techniques so concepts like slope and coordinates land in a way that makes sense to each student.
-
Problem-Solving and Critical Thinking: Our tutors know when to offer support and when to let a student work through a problem on their own. That balance is what builds lasting independence.
-
An Engaging and Fun Learning Environment: Sessions are designed to keep students motivated and enjoying the process. We celebrate every bit of progress, and that consistent recognition builds confidence with each session. Over time, students develop a more positive relationship with math and greater confidence in their own abilities.
The results reflect that approach:
-
94% of parents report improvement in their child's math skills and understanding
-
93% of parents report an improved attitude toward math after attending Mathnasium
-
90% of students saw improvement in their school grades
We operate over 1,100 centers across North America, bringing our proven approach to communities everywhere.
Families across Johns Creek and the surrounding area can visit Mathnasium of Johns Creek, a trusted local center with a proven record of building confident math thinkers.
Whether your student is looking to catch up, keep up, or get ahead in math, our local team is happy to help!
📅 Schedule a Free Diagnostic Assessment at Mathnasium of Johns Creek
Not near Johns Creek?
📍 Find a Mathnasium Learning Center Near You
Pssst! Check Your Answers Here
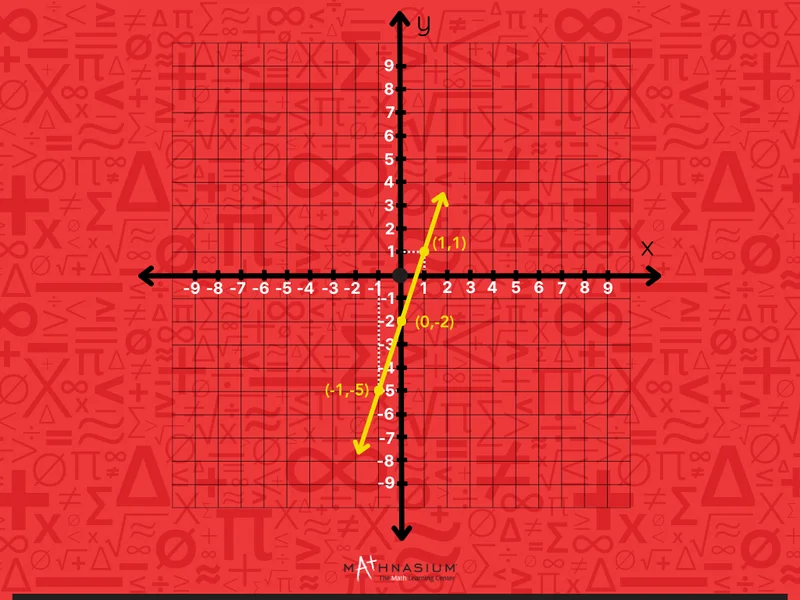
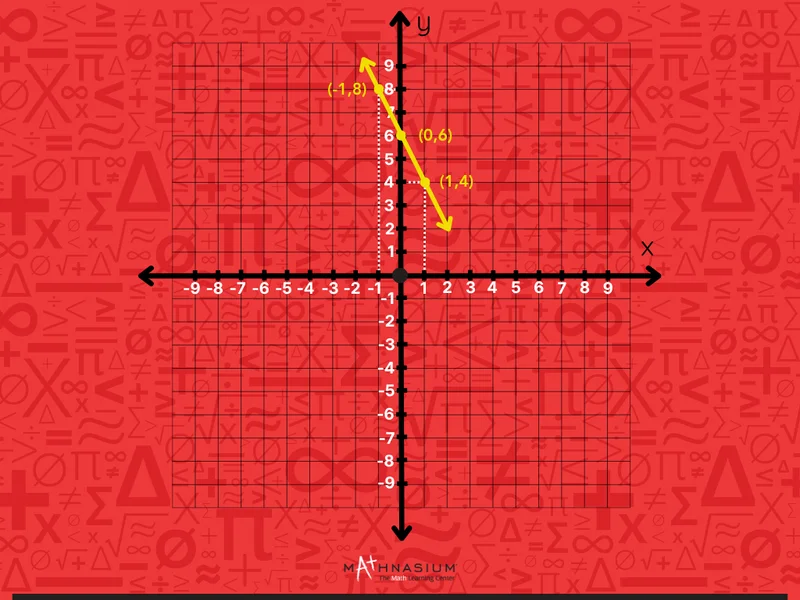
Here are the worked-out solutions for both practice equations. It doesn't matter which x values you chose. Every correct set of points lands on the same line, so your graph should match the ones here.
Solution 1: y = 3x - 2
Solution 2: y = -2x + 6


 (770) 273-9697