In data literacy, knowing whether a set of values is discrete or continuous shapes how we analyze, interpret, and represent information visually. From bar charts with separated columns to smooth, unbroken line graphs, each data type follows its own mathematical rules.
If we choose the wrong type, we can completely change the story our numbers are trying to tell.
That’s why today, our Mathnasium tutors show how to tell discrete and continuous data apart, and how that difference shapes the way we work with numbers.

What is Discrete Data?
Discrete data is information that can only take specific, separate values and is collected by counting. While these values are usually whole numbers, they don’t strictly have to be.
The defining rule is that there is a strict, measurable gap between each value.
Let's look at a quick analogy to see how this works in practice.
Imagine we are visiting a local shoe salesman. He is looking at his inventory and notes that he only has shoes in sizes ranging from 5 to 7. Because shoes are produced in fixed sizes, his shelves hold sizes 5, 5.5, 6, 6.5, and 7.
Notice that there are absolutely no sizes in between these numbers. Because manufacturers only produce these specific, fixed sizes, the salesman can never hand a customer a size 5.23 or a size 6.11. This is exactly what discrete data measures!
Now, let's say we want to help our salesman look at his business. We can represent these values through a graph to see exactly how many shoes he sold for the day.
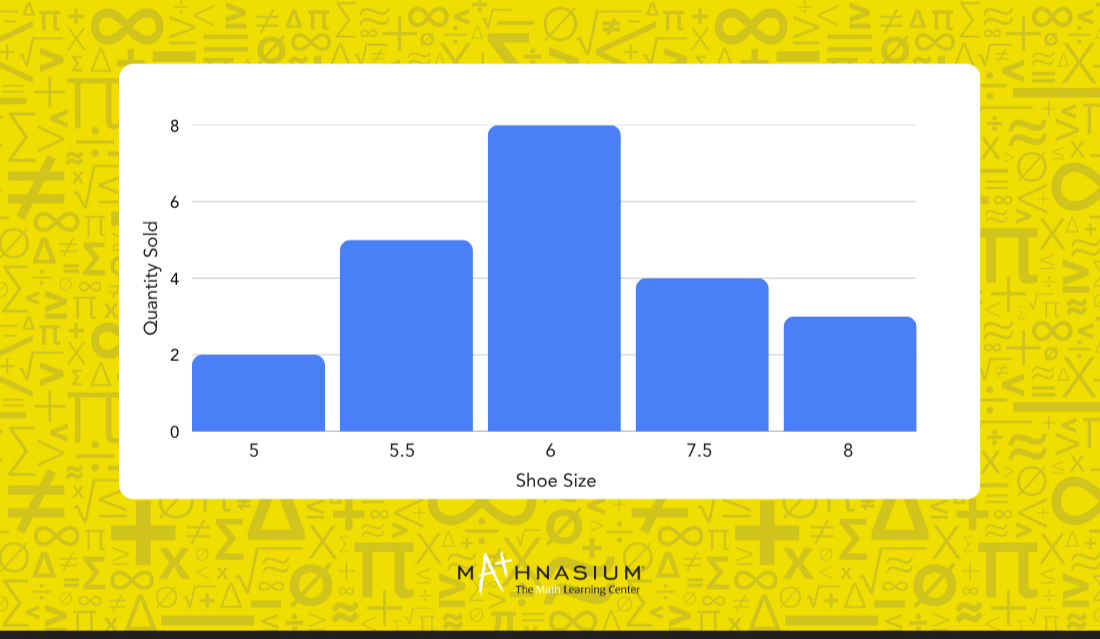
Take a close look at the bars on our chart. What do you notice about how they are spaced?
Exactly! The bars do not touch.
We leave spaces between the bars to show that each shoe size is its own independent choice. There are no "in-between" options.
Discrete data focuses on counting “how many” items exist. This means that we count distinct objects or values one by one, producing a restricted set of numbers.
Think about counting things like:
-
The number of students in a class (since you can have 22 or 23 students, but never 22.5)
-
The outcome of a dice roll (where you can only roll a fixed number from 1 to 6)
-
The number of cars in a parking lot (as you count individual, separate vehicles)
-
The amount of money in dollar bills (where you count exact, physical bills one by one)
📕 You May Also Like: What Is a Bar Model in Math? A Complete Overview
What is Continuous Data?
Continuous data is information that can take any value within a specific range because it is collected by measuring. Instead of sticking to fixed numbers, continuous data flows smoothly. Which means there are an infinite number of possible values between any two points.
To help us picture this, let's use a real-life example.
Let's imagine we set up a digital thermometer outside our window to track the outdoor temperature over a 12-hour day. When we check it in the morning, it might say it is 60°F, and by afternoon, it might reach 72°F.
Think about how the air warms up. Does the temperature instantly jump straight from 60°F to 61°F?
No, it has to pass through 60.1°F, 60.15°F, 60.154°F, and every tiny fraction of a degree in between.
To see how this continuous movement looks over time, we can represent these values through a graph.
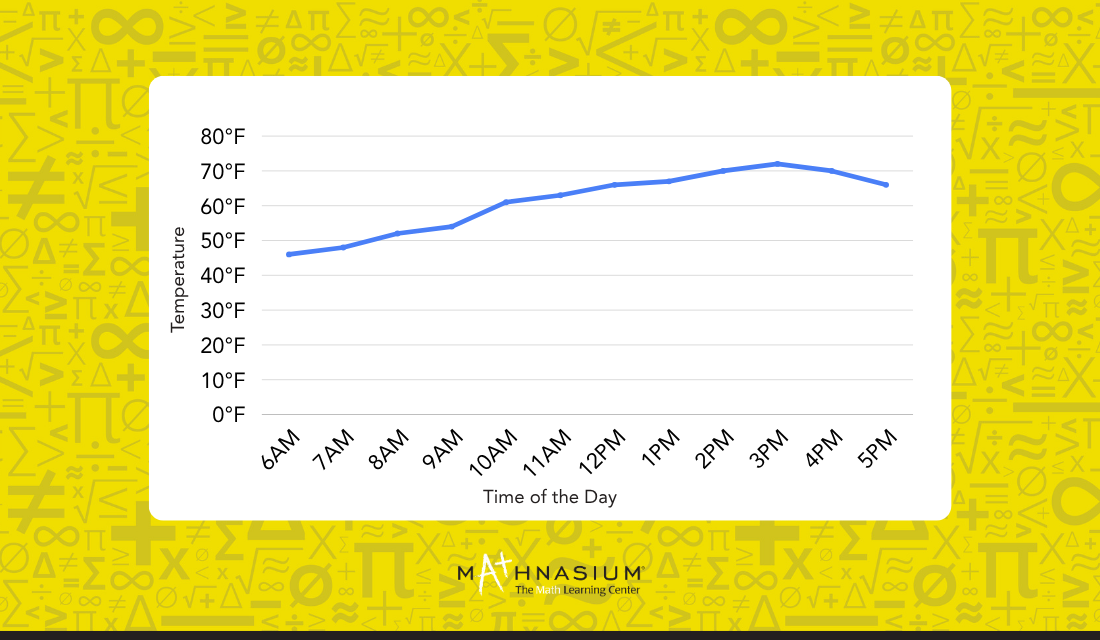
Let's take a close look at how the data on our chart is drawn. What do we notice about the shape?
Spot on! We see an unbroken line.
We connect the data points with a continuous line because time and temperature never stop moving.
Whenever we work with continuous data, we are exploring the concept of measuring 'how much'. Think about measuring things like:
-
A person's height (since someone can be exactly 5 feet and 4.5 inches tall)
-
Time in a race (which we measure down to the exact millisecond)
-
The weight of a puppy (which changes continuously in ounces and pounds as they grow)
-
The distance of a car ride (as the odometer tracks every fraction of a mile traveled)
📕 You May Also Like: How to Read 4 Most Common Graphs - A Kid-Friendly Guide
So, What is the Difference Between Discrete and Continuous Data?
The main difference is that discrete data consists of specific, separate values collected by counting, while continuous data can take any value within a range collected by measuring.
Both are ways to organize and understand information, but they use different types of numbers and look completely different when we turn them into a graph.
Let’s see how the two compare side by side.
|
Feature
|
Discrete Data
|
Continuous Data
|
| How we get it |
Count distinct objects or values one by one. |
Measure values across a smooth scale. |
| How the numbers behave |
Jumps between fixed options with strict gaps in between. |
Flows smoothly with infinite possible numbers between points. |
| How it looks on a graph |
Bar chart where the bars do not touch. |
Line graph with a smooth, unbroken curve. |
| Real-world example |
The number of students in a class or a shoe size. |
A person's height or the temperature outside. |
Whenever we are looking at a set of numbers and trying to decide which category it fits into, we can ask ourselves this question: "Can this value be split into infinite, tinier fractions in real life?"
This question helps us look past the numbers on our paper and think about how the object actually behaves in the real world.
-
If we look at the number of text messages we sent today, the answer is no. We can send 10 texts or 11 texts, but we cannot send 10.7 texts. There is a gap. This means it is discrete.
-
If we look at the time it takes to finish our homework, the answer is yes. It could take us 30 minutes, or 30.5 minutes, or exactly 30.523 minutes if we used a highly precise stopwatch. There are no gaps. This means it is continuous.

Quiz: How Well Do You Know Discrete and Continuous Data?
Our tutors put together six questions to test what we covered today. Work through each one and choose the answer that fits best.
Question 1: What do we call data that consists of specific, separate values collected by counting?
a) Continuous data
b) Discrete data
c) Average data
Question 2: What do we call data that can take any value within a range because it is collected by measuring?
a) Discrete data
b) Continuous data
c) Whole number data
Question 3: Which of these is an example of discrete data?
a) The temperature outside
b) The number of cars in a parking lot
c) The distance of a car ride
Question 4: Which of these is an example of continuous data?
a) The outcome of a dice roll
b) The number of students in a class
c) A person's height
Question 5: On a graph, discrete data usually appears as:
a) A line graph with a smooth, unbroken curve
b) A bar chart where the bars do not touch
c) A single connected dot
Question 6: We want to know whether a value can be split into infinite, tinier fractions in real life. If the answer is yes, what kind of data are we looking at?
a) Discrete data
b) Continuous data
c) Neither discrete nor continuous data
 Mathnasium tutors use hands-on examples and real-world comparisons to help concepts like these make sense to every student.
How Mathnasium Helps Students Master Any Math Concept
Mathnasium is a math-only learning center dedicated to helping K-12 students of all skill levels learn and master math.
To help students build a deep understanding of any math concept, including discrete and continuous data, we rely on our proprietary teaching approach, the Mathnasium Method™, designed around individual student needs and learning styles.
Each student begins their Mathnasium journey with a diagnostic assessment that gives us a clear picture of their current skill level, learning goals, and learning style.
From there, we build a personalized learning plan that targets exactly what each student needs.
Our specially trained tutors follow that plan closely, delivering face-to-face instruction in a caring and fun small-group environment.
During sessions, we draw on a mix of verbal, visual, mental, tactile, and written techniques so students can approach concepts from multiple angles and truly make sense of what they're learning.
When students get stuck on a concept, we break it down into manageable steps and work through both the how and the why. In time, that approach builds the critical thinking and problem-solving skills students carry with them into every area of math and beyond.
We build fun into how we work, making sessions game-based and hands-on, celebrating progress at every step, and watching confidence grow alongside skill.
The results speak for themselves:
-
94% of parents report an improvement in their child's math skills and understanding
-
93% of parents report their child's improved attitude toward math after attending Mathnasium
-
90% of students saw an improvement in their school grades
With over 1,100 learning centers across North America, there's likely a Mathnasium near you.
For families in and around Ladera Ranch, CA, Mathnasium of Ladera Ranch brings our proven approach to local students. Families trust our center to help students build lasting math skills and confidence.
Start by scheduling a free diagnostic assessment with us. Our team will use it to create a personalized plan for math mastery.
📅 Contact Mathnasium of Ladera Ranch
Pssst! Check Your Answers Here
Here are the answers. How did you do?
Question 1: b) Discrete data.
Question 2: b) Continuous data.
Question 3: b) The number of cars in a parking lot.
Question 4: c) A person's height.
Question 5: b) A bar chart where the bars do not touch.
Question 6: b) Continuous data.


 (949) 429-3020
 (949) 429-3020