You might have come across word problems that are hard to understand on the first, second, or even third read. For problems like these, we need a tool that shows us how the information fits together.
That’s where tape diagrams come in. They use bars and segments to represent the quantities in a problem, so we can see how they are connected. With tape diagrams, we can compare amounts more easily and make sense of equations and ratios.
Want to add tape diagrams to your math toolkit? Join us as we explore what a tape diagram is, the different types you might see, and how to use tape diagrams to solve word problems step by step.

What Is a Tape Diagram?
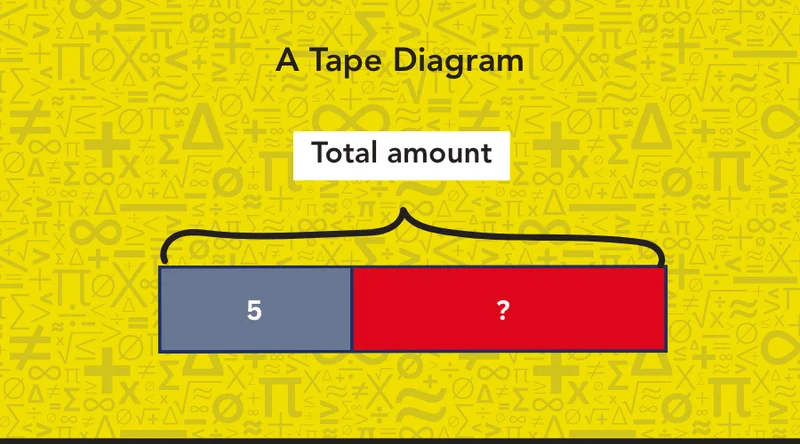
A tape diagram is a visual model that uses one or more rectangular bars to represent quantities and show how they are related.
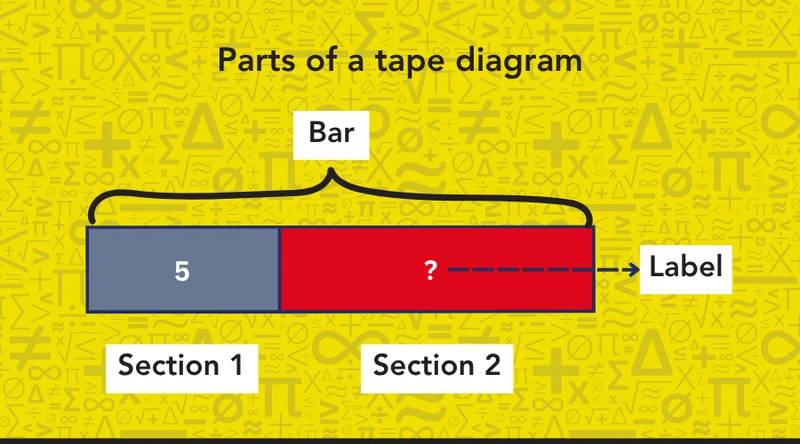
We can build a tape diagram with three basic parts:
-
A bar: a long rectangle that stands for one whole quantity
-
Sections: smaller parts of the bar that show how the whole is divided
-
Labels: numbers, words, or question marks that show what we know and what we still need to find
Imagine you have a $15 gift card, and you already used $6 of it. We can draw one long bar to represent the full $15. Then we split the bar into two parts:
-
one part for the $6 already used,
-
one part for the amount left, which we do not know yet.
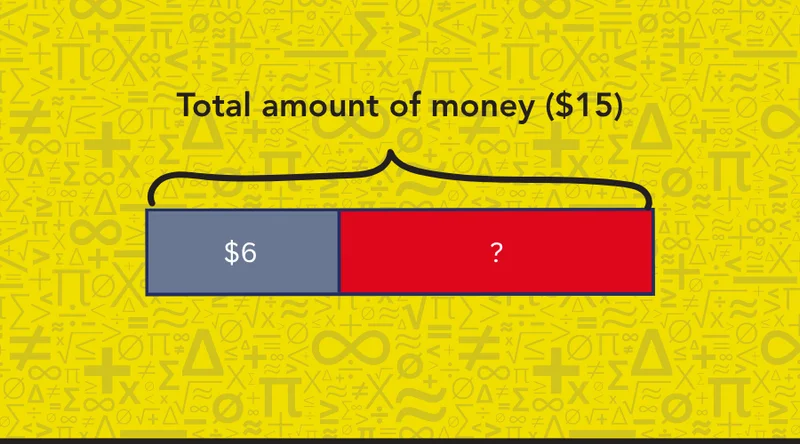
Now we can see how the $15 is split between the amount already used and the amount still left.

Types of Tape Diagrams
Depending on the relationship we want to show, we can use different types of tape diagrams.
We build each one with the same basic tools, bars, and labels but arrange them in ways that match the problem we’re solving.
Let’s look at three common types.
1. A Part-Whole Tape Diagram
A part-whole tape diagram shows one bar split into two or more sections to represent how smaller parts combine to make a whole.
We reach for this type of diagram when we need to:
We’ll see how it works with an example. Say you have $60. You want to buy a game for $28, save $20 for a headset, and use whatever is left for a friend’s birthday present.
We start with one bar for the full $60. Then we mark off $28 for the game and $20 for the headset. The final section shows the amount left for the birthday present.
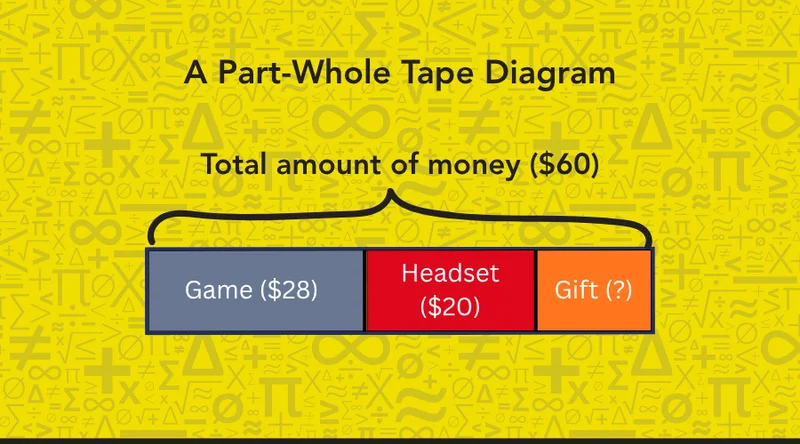
The diagram lets us see all three parts inside the same total.
2. A Tape Diagram of Equal Groups
A tape diagram of equal groups splits one bar into several same-sized sections, where each section stands for one equal group.
This type works well for multiplication and division problems any time a total is made up of several groups that are all the same size.
Suppose your class is setting up 7 tables for a game, with 6 students at each table.
We can divide the bar into 7 equal parts so each part stands for one table. Since each table has 6 students, we label every section with 6.
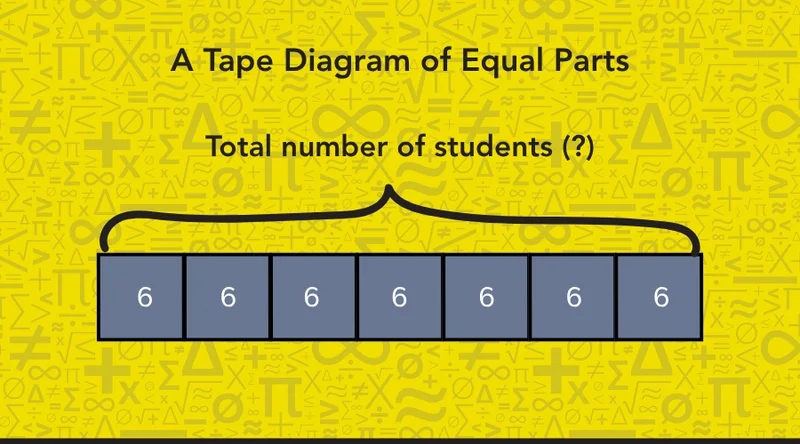
The diagram shows 7 equal groups of 6, so we can see that this setup calls for multiplication.
3. A Double-Bar Tape Diagram
A double-bar tape diagram uses two bars, stacked one above the other, to compare two quantities side by side.
We turn to this type of tape diagram for comparison problems, where one amount is larger or smaller than another, and for problems involving a ratio between two quantities.
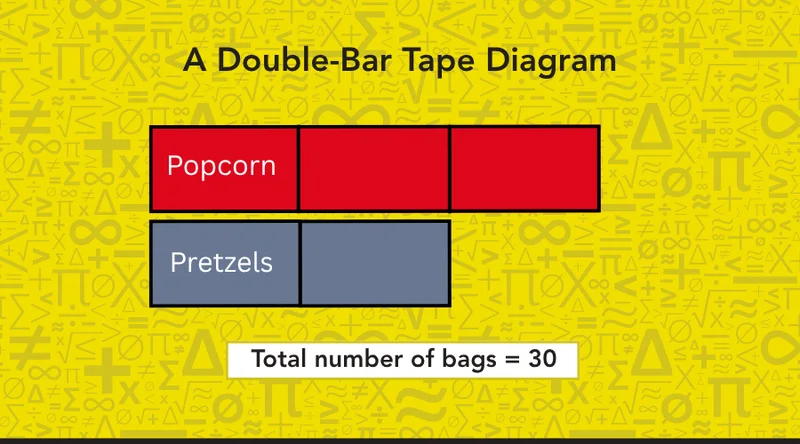
For example, your school club is preparing 30 snack bags for a school event. You want 3 popcorn bags for every 2 pretzel bags.
We can show that relationship with two bars. We divide the popcorn bar into 3 equal sections and the pretzel bar into 2 equal sections, then place the bars one above the other.
Step 3: Build an equation using the diagram
As long as we can see how the quantities are related, we can use that structure to write an equation that matches the diagram.
How to Turn a Tape Diagram Into an Equation
To help you connect what you see in the diagram with the equation it may represent, we created this quick table.
|
What the diagram shows
|
Equation pattern
|
|
One bar split into parts
|
part + part = total
|
|
One bar with one known part and one missing part
|
known part + ? = total
|
|
Two stacked bars with a difference between them
|
larger amount − smaller amount = difference
|
|
One bar split into equal groups, with the size of each group known
|
number of groups × group size = total
|
|
One bar split into equal groups, with the total known
|
total ÷ number of groups = group size
|
|
Bars showing a ratio with the same-sized parts
|
value of one part × number of parts = total
|
Our diagram shows 1 part for Bill and 3 same-sized parts for Mike. That gives us 4 equal parts altogether, with a total value of 48 points. We can use x for the value of one part and write the equation:
4x = 48.
Step 4: Solve the equation
We have the equation: 4x =48. We solve it to find the value of one part:
4x = 48
4x ÷ 4 = 484
x = 12
This means each part equals 12 points. Since Bill’s score is 1 part, he has 12 points. And as Mike’s score is 3 parts, he has:
3 × 12 = 36 points.
We can check our answer: 12 + 36 = 48, which matches the total we started with, so our answer is correct.
📕 You May Also Like: How to Solve Basic Equations — A Parent and Student Guide
Your Turn! Put a Tape Diagram to Work
Practice solving word problems with tape diagrams on your own. You can check yourself at the bottom of the page.
A bakery packs 90 muffins equally into 15 boxes. How many muffins go in each box?
📕 You May Also Like: Why Math Practice Matters & What Happens When Kids Skip It

Mathnasium tutors use different teaching techniques and hands-on activities to help students make sense of math concepts.
How Mathnasium Helps Students Work With Diagrams (and Beyond)
Mathnasium is a math-only learning center dedicated to helping K–12 students of all skill levels excel in math.
We aim to develop a true understanding of math concepts, including tape diagrams, so students can use them with confidence in new problems.
To reach that level of understanding, we use the Mathnasium Method™, our proprietary teaching approach, to meet students where they are and guide them forward step by step.
Each student begins with a diagnostic assessment that helps us understand their current skill level, knowledge gaps, goals, and how they think and feel about math. For word problems, that may include looking at how they identify important information, recognize relationships between quantities, and decide which operations make sense.
Using these insights, we build a personalized learning plan focused on the skills the student needs most, whether that means interpreting word problems, representing relationships with tape diagrams, choosing an operation, or preparing for more advanced problem-solving.
Our specially trained tutors follow that plan closely and provide live, face-to-face instruction in a caring and fun group environment. They use mental, verbal, visual, tactile, and written techniques to help students draw diagrams, compare quantities, label known and unknown values, and connect the visual model to the calculation.
Students also get room to think through problems before tutors step in. Our tutors guide them through the problems instead of simply giving them the correct answers. This helps students build critical thinking, problem-solving skills, and greater independence with unfamiliar word problems.
Fun is part of the approach, too. We use hands-on and game-based activities, rewards, and consistent encouragement to keep students engaged as they solve different kinds of math problems.
Families see the difference:
-
94% of parents report an improvement in their child's math skills and understanding
-
93% of parents report their child's improved attitude toward math after attending Mathnasium
-
90% of students saw an improvement in their school grades
With over 1,100 learning centers across North America, there is likely a Mathnasium close to you.
For families in and near Farmington, Utah, Mathnasium of Farmington brings that same approach close to home, with specially trained tutors who help students make sense of word problems, visual models, and the reasoning skills that build from them.
If your child needs to catch up, keep up with current coursework, or is ready to get ahead, a free diagnostic assessment is a great place to start. Using what we learn, we create a personalized learning plan focused on the skills they need next.
📅 Schedule a Free Assessment at Mathnasium of Farmington
Not near Farmington?
📍 Find a Mathnasium Learning Center Near You
Pssst…! Check Your Answer Here
Ready to see how you did? Here’s the answer to the practice problem above.
The bakery will put 6 muffins in each box.
1. We start by identifying the problem type. We know the total number of muffins is 90, and we have 15 boxes with equal numbers of muffins in each. That tells us we need a tape diagram of equal groups.
2. Our diagram may look like this: one bar labeled 90 total, split into 15 equal sections, each labeled ? muffins because we do not know the number of muffins yet.
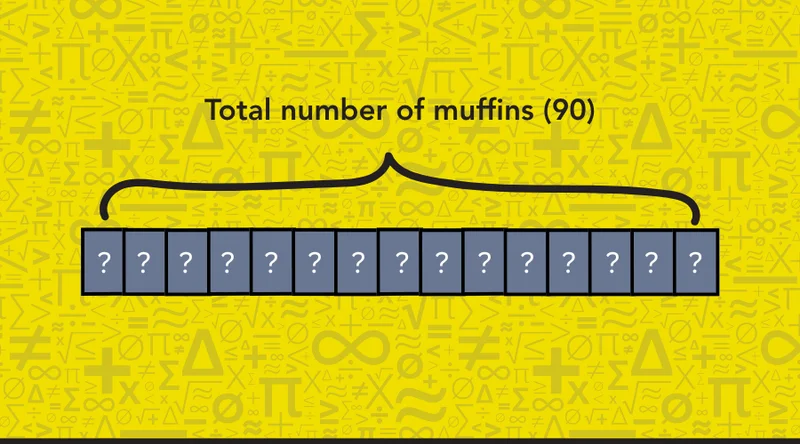
3. In the diagram, each of the 15 sections stands for one box, and all 15 sections together make 90 muffins. We can let x stand for the number of muffins in each box. That gives us:
15x = 90
4. Then we solve the equation:
15x = 90
15x ÷ 15 = 90 ÷ 15
x = 6
So, each box will hold 6 muffins.


 (801) 928-7671
 (801) 928-7671