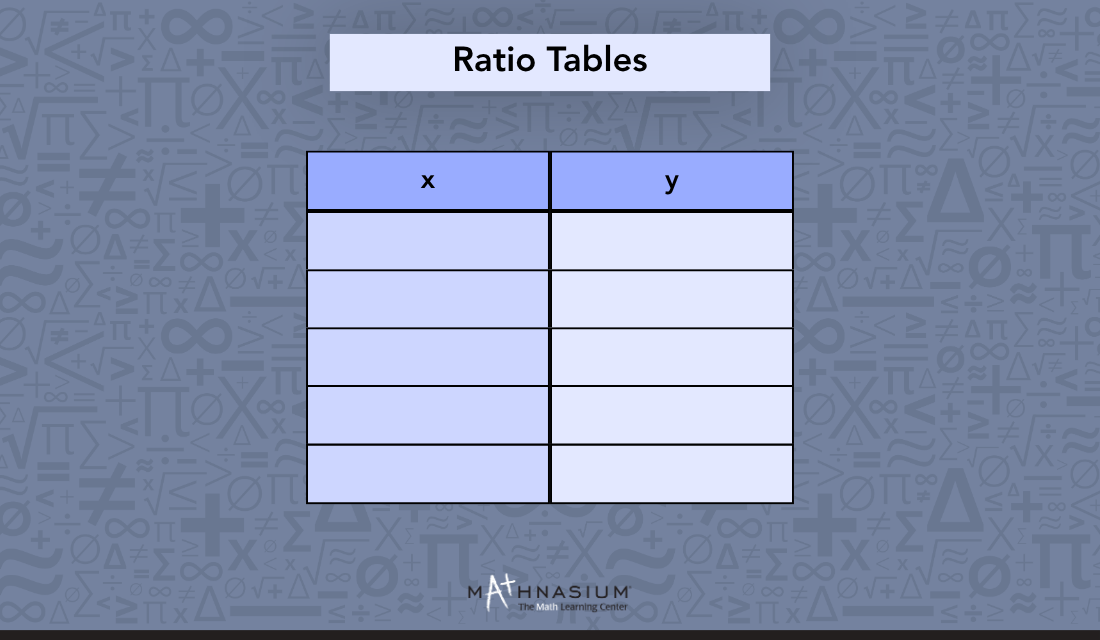
Proportion problems can turn into a maze of numbers once the algebra sets in. A ratio table clears that up. Instead of solving one equation at a time, we scale numbers, spot patterns, and find missing values right on the table itself.
Today, our Mathnasium tutors will explain what a ratio table is, how to build one from scratch, and how to solve one step by step.

Quick Review: What is a Ratio?
A ratio compares two quantities and tells us how much of one thing there is relative to another.
Say we're making hot chocolate, and the recipe calls for 2 scoops of cocoa powder for every 1 glass of milk.
We can express that comparison as a ratio, and we have three ways to write it down:
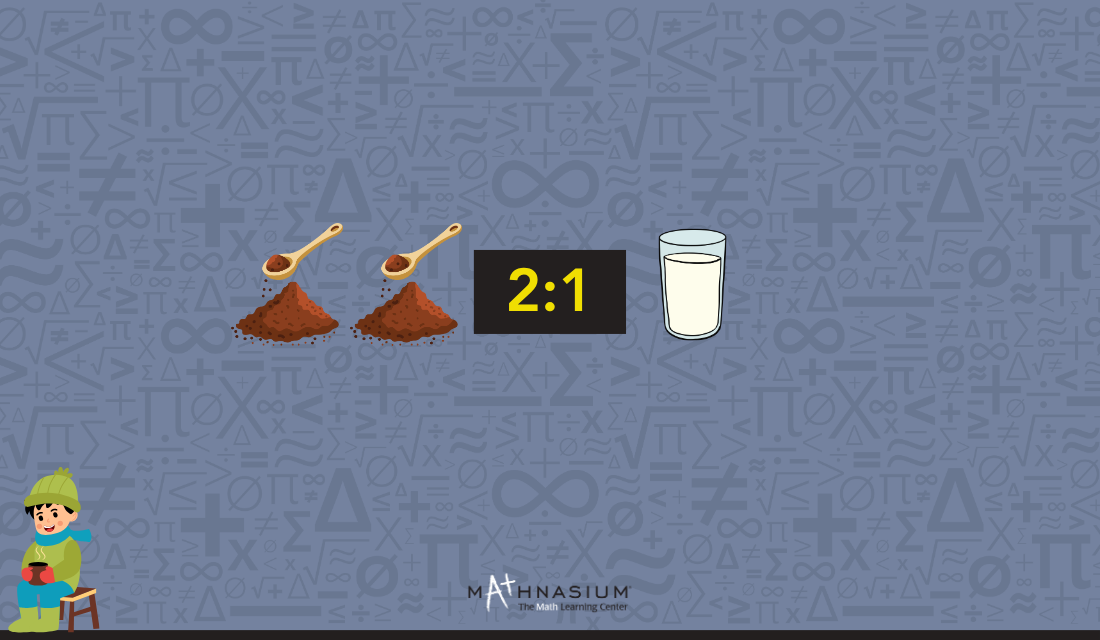
All three say the same thing. We're comparing 2 scoops of cocoa powder to 1 glass of milk, in that order, since order matters when we write a ratio.
Now, what if we want to make more hot chocolate at once?
If we want our hot chocolate to taste consistent, the ratio of cocoa to milk has to stay the same.
That's where a ratio table can help us out!

What Is a Ratio Table?
A ratio table is a chart that lists a ratio's equivalents in rows, each one built by scaling the same relationship up or down. It can be positioned horizontally or vertically, with one row or column for each quantity we're comparing.
We know the ratio is 2 scoops of cocoa for every 1 glass of milk. If we want to make a bigger batch, we need to scale both numbers by the same amount.
For 2 batches, we multiply both numbers by 2:
For 3 batches, we multiply both numbers by 3:
For 4 batches, we multiply both numbers by 4:
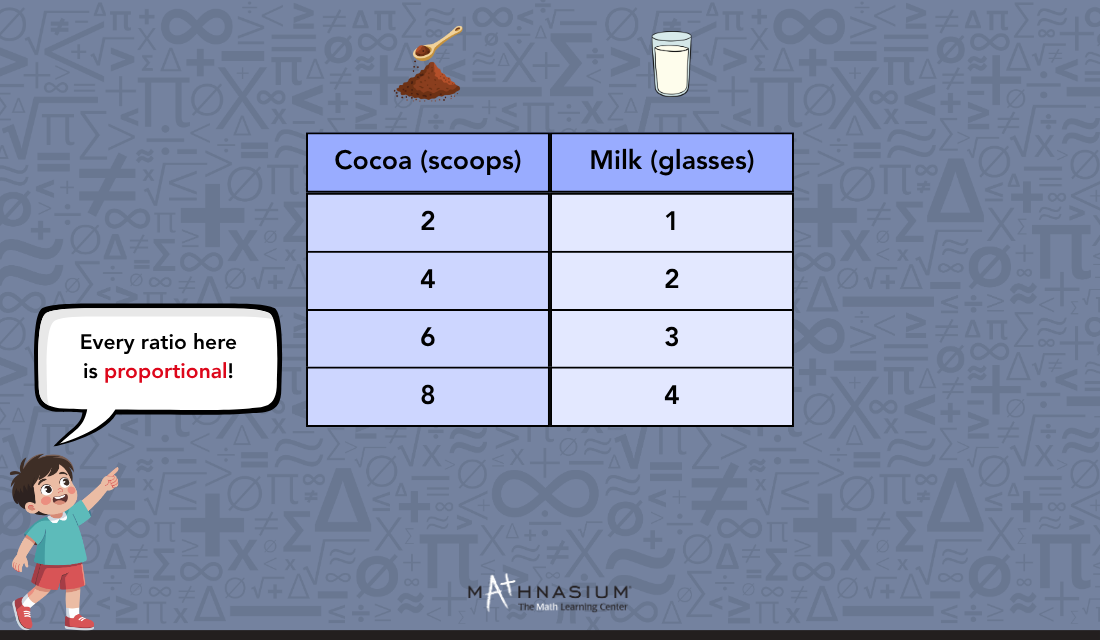
Now we can lay each new batch out as its own row.
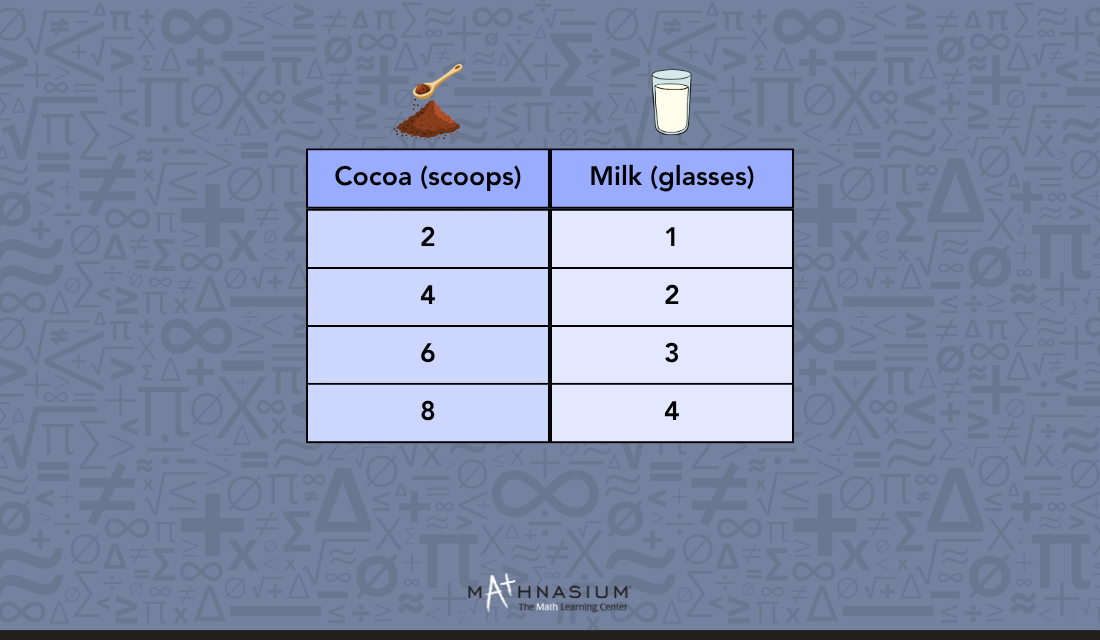
So what is this table actually showing us?
Every row describes the exact same relationship between cocoa and milk, just at a different size.
The second row, 4 to 2, isn't a new recipe. It's the same 2-to-1 relationship, doubled. The same goes for 6 to 3 and 8 to 4.
We call each of these rows an equivalent ratio because if you divide any of these by their greatest common factor, they all simplify right back down to 2:1, the simplest form of this ratio.
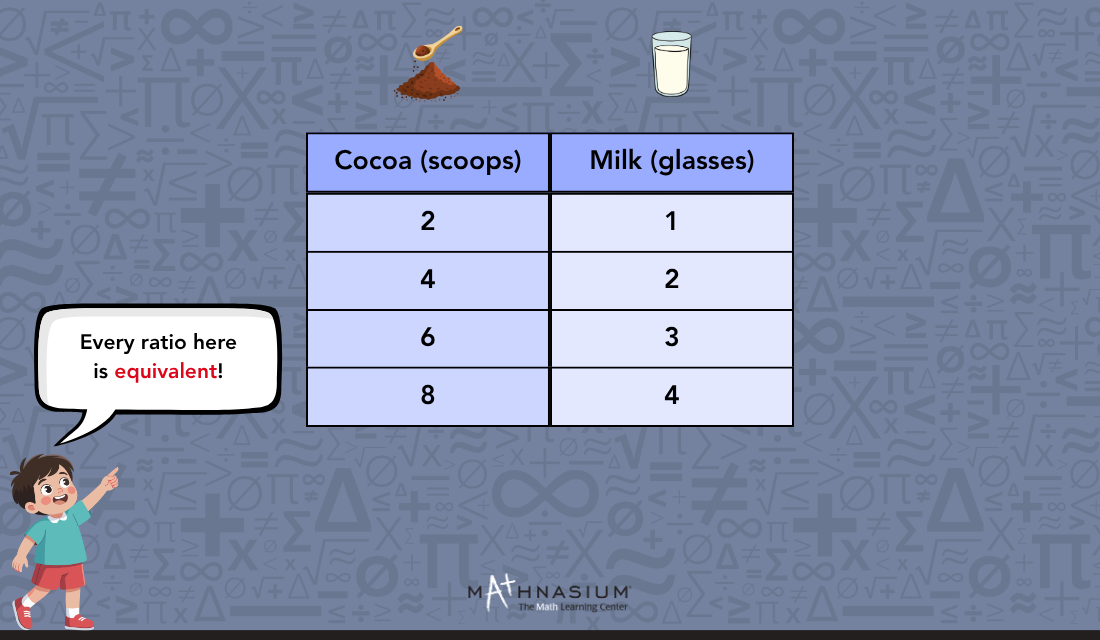
Something else a ratio table reveals is proportions.
Whenever you compare two equivalent ratios from the table, you can write them as an equation like this:
\(\Large\frac{4}{2}\) = \(\Large\frac{6}{3}\)
Which means that every pair of rows in our table gives us a proportion, all built from that same starting relationship.
That's exactly what makes a ratio table so useful. It takes a relationship we can only picture one way and lets us see it at every size at once.
Instead of solving one proportion at a time, we can scale, compare, and find missing values just by reading across the table, which makes it one of the most useful tools we have for building proportional thinking.
📕 You May Also Like: Ratio vs. Proportion Difference: A Kid-Friendly Guide
How to Build a Ratio Table: Step-by-Step
To build a ratio table, we start by identifying our base ratio and setting up our columns. From there, we can scale our numbers up or simplify them down to fill in as many rows as we like.
Let's put that into practice with a new example. Say a bag contains 8 red marbles for every 12 blue marbles.
Step 1: Identify the starting ratio.
First, we need to identify the two related quantities in our problem.
Here, that's 8 red marbles to 12 blue marbles, so our starting ratio is 8:12.

Step 2: Set up the table.
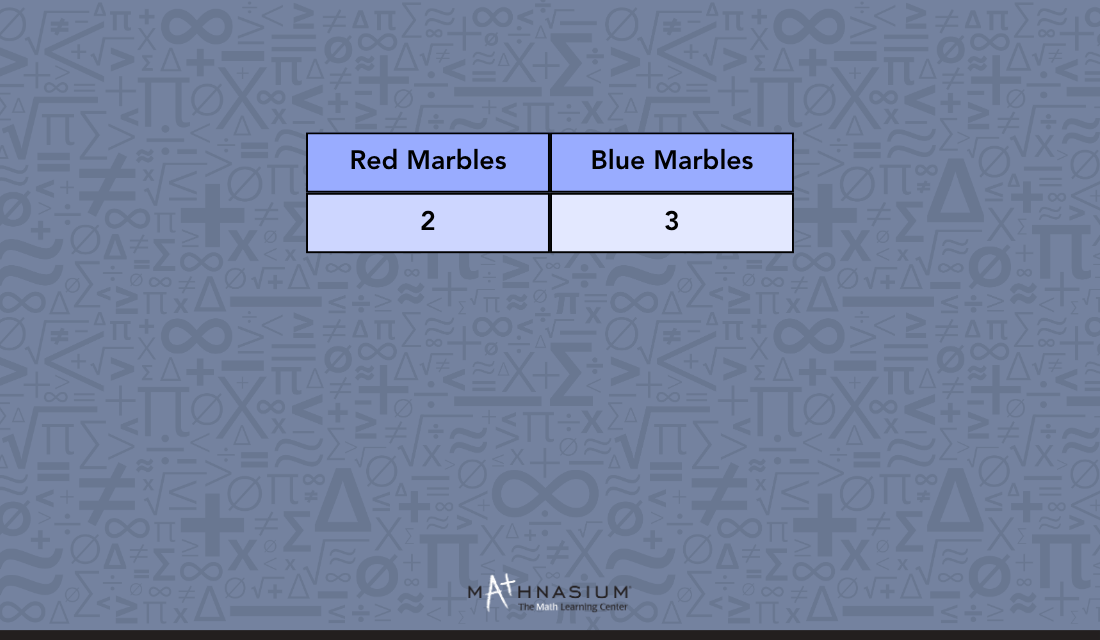
A table with two rows or two columns is all we need, one for each quantity we're comparing.
Since we're comparing red marbles to blue marbles, we label one "Red Marbles" and the other "Blue Marbles."
Step 3: Simplify to find the smallest version of the ratio.
Notice anything about 8:12? It's not in its simplest form yet.
We can simplify it by dividing both numbers by their greatest common factor, which is 4:
8 ÷ 4 = 2
12 ÷ 4 = 3
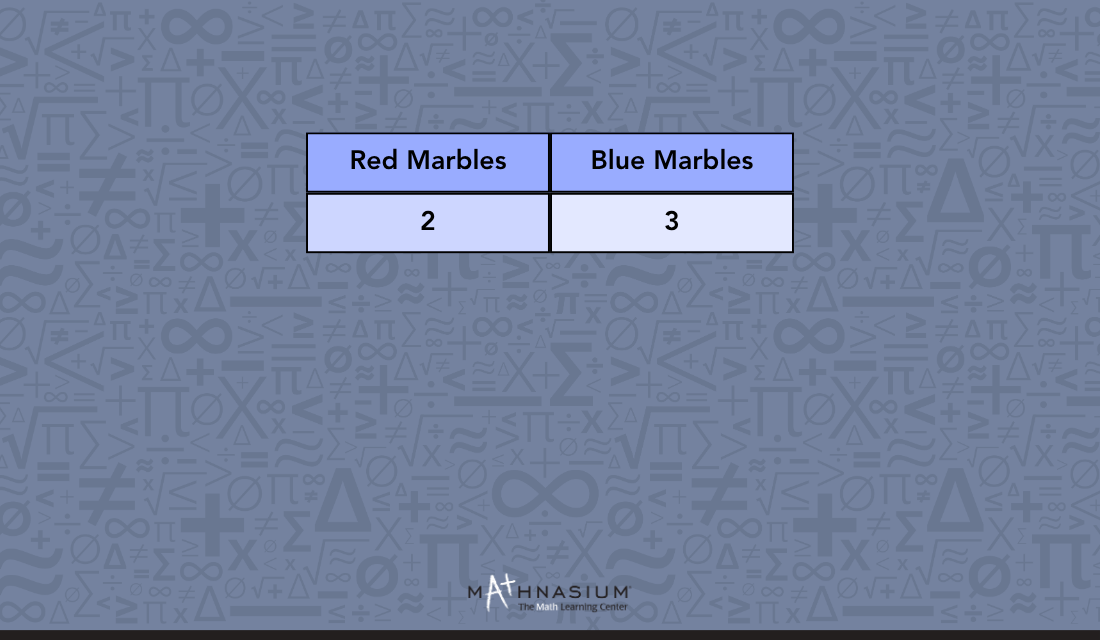
That gives us 2:3, the simplest form of our ratio.
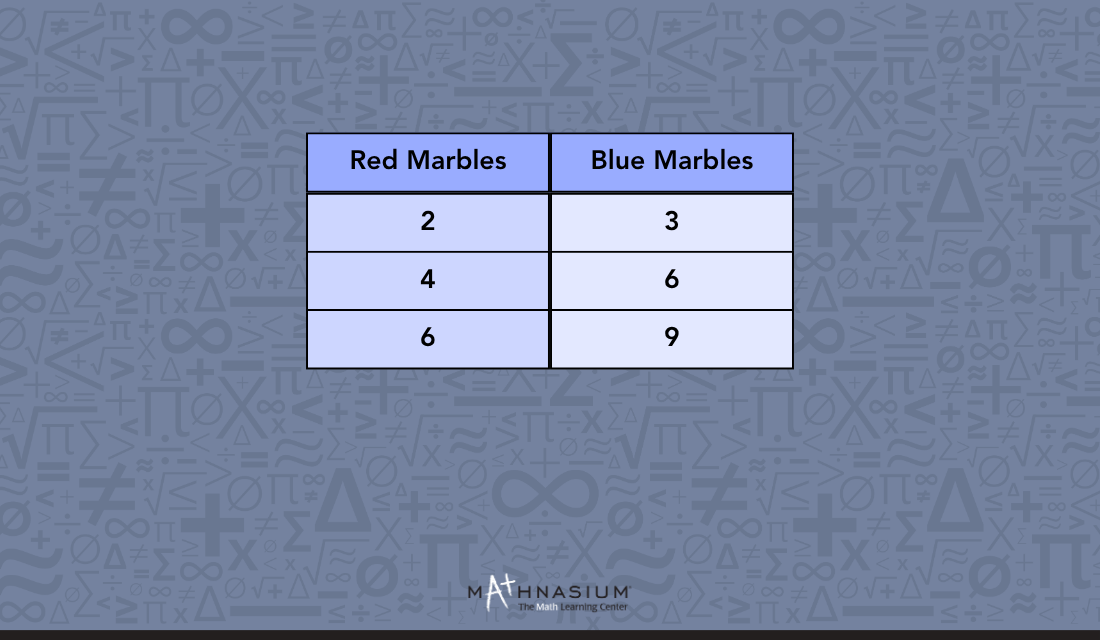
Now this becomes our first entry, so let’s put it in our table.
Step 4: Scale up to fill in the rest of the rows.
Now that we have the simplest form, we pick a scale factor and multiply both parts of the 2:3 ratio by it, one row at a time.
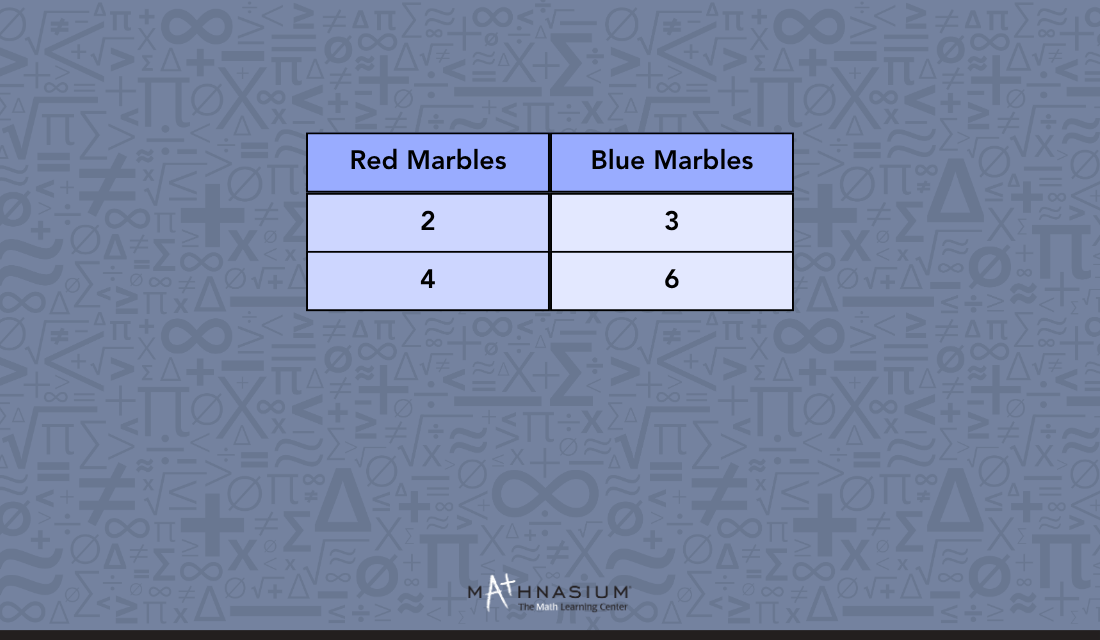
For 2 bags, we multiply both numbers by 2:
2 × 2 = 4 red marbles
3 × 2 = 6 blue marbles
For 3 bags, we multiply both numbers by 3:
2 × 3 = 6 red marbles
3 × 3 = 9 blue marbles
For 4 bags, we multiply both numbers by 4:
2 × 4 = 8 red marbles
3 × 4 = 12 blue marbles
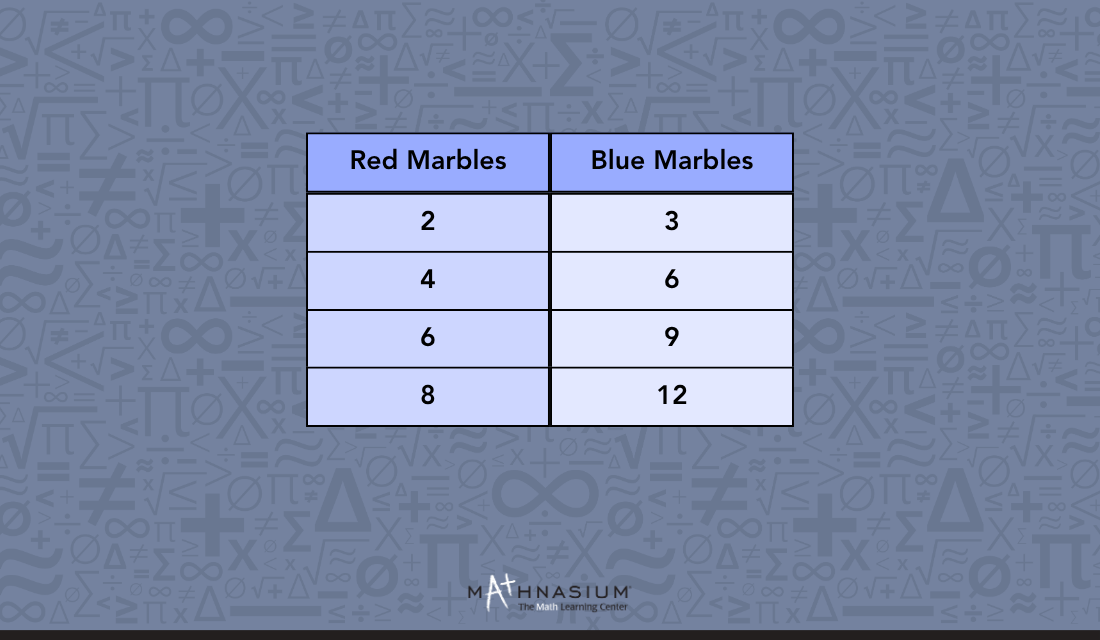
Notice that this last row brings us right back to our original 8:12. That's not a coincidence. It confirms that every row in our table, no matter how far we scale, describes the same relationship.
We can keep going and add more rows if we want. But the most important thing to remember is that whatever we do to one part of the ratio, we have to do to the other.
📕 You May Also Like: Ratio to Percentage: How to Convert Between the Two
How to Solve a Ratio Table
To solve a ratio table, we look for the multiplier that connects our columns and use it to fill in the missing numbers.
We can find this multiplier by dividing one value by the other or simply spotting the pattern if the numbers are straightforward.
Let’s try to solve this ratio table together.
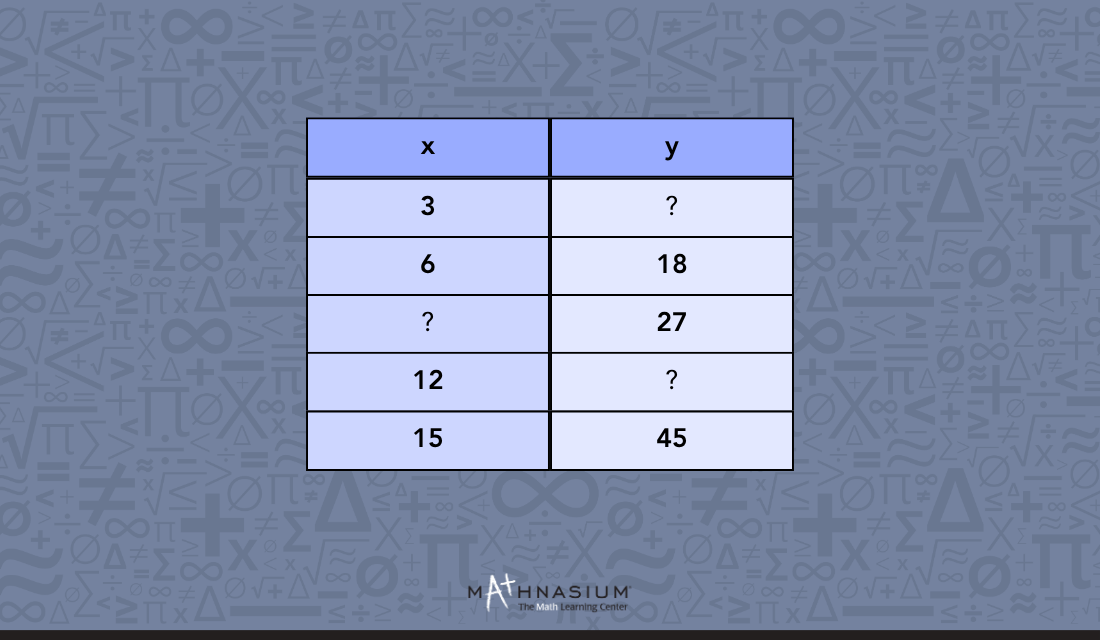
As we can see in our table, the only two known ratios are 6:18 and 15:45. We can use them to find our common multiplier.
To find it, we always divide the bigger number by the smaller one.
We divide y by x for row 2:
18 ÷ 6 = 3
We check that against row 5 to make sure it holds up.
45 ÷ 15 = 3
Both rows agree, so 3 is our common multiplier.
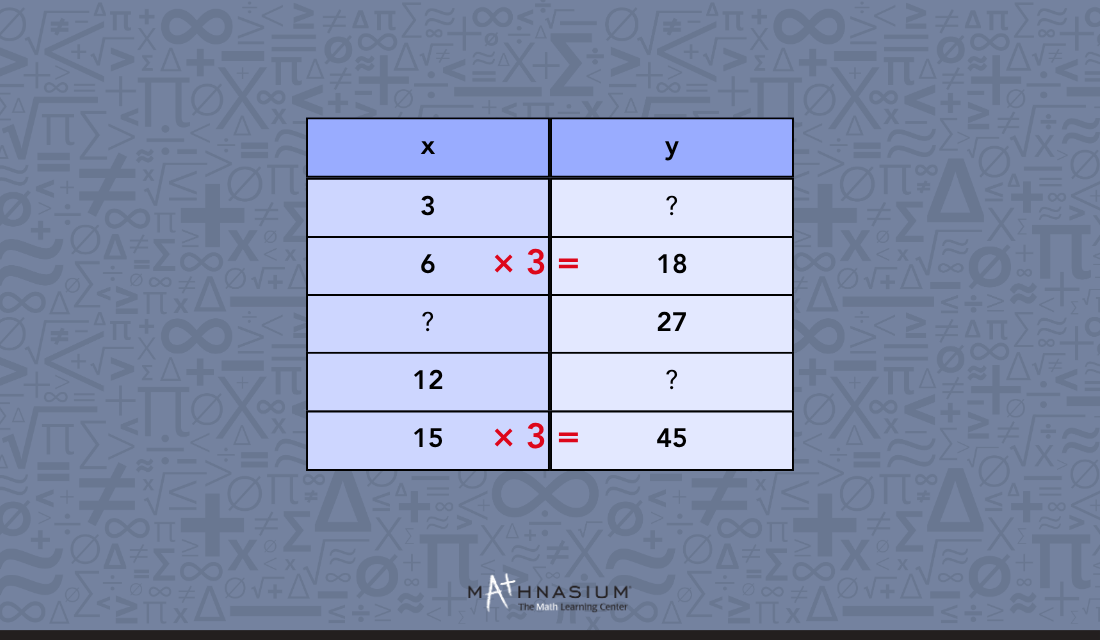
Not every ratio table works out to a whole number like this one. We might end up with a common multiplier that is a fraction or a decimal, depending on the numbers we're working with.
Let’s continue and find our first two missing y-values. Since we have a common multiplier, we can multiply the known values from our x-column by 3.
3 × 3 = 9
12 × 3 = 36
Here's our table with those two values filled in.
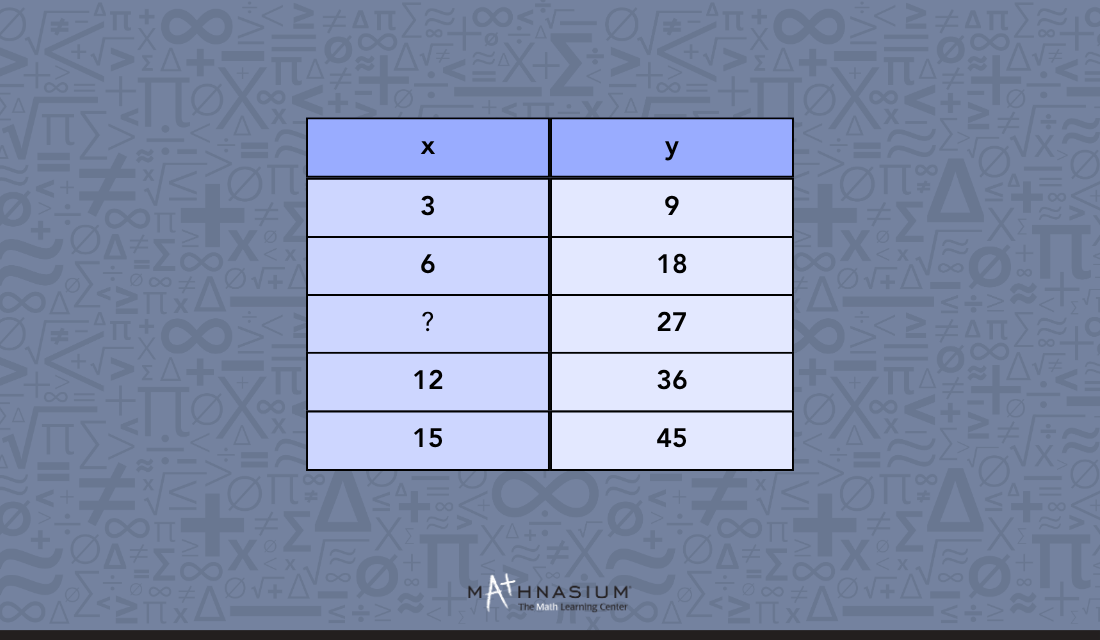
Row 3 is a bit different. This time we know y, but not x, so multiplying won't help. Instead, we need to work backward and divide y by our common multiplier:
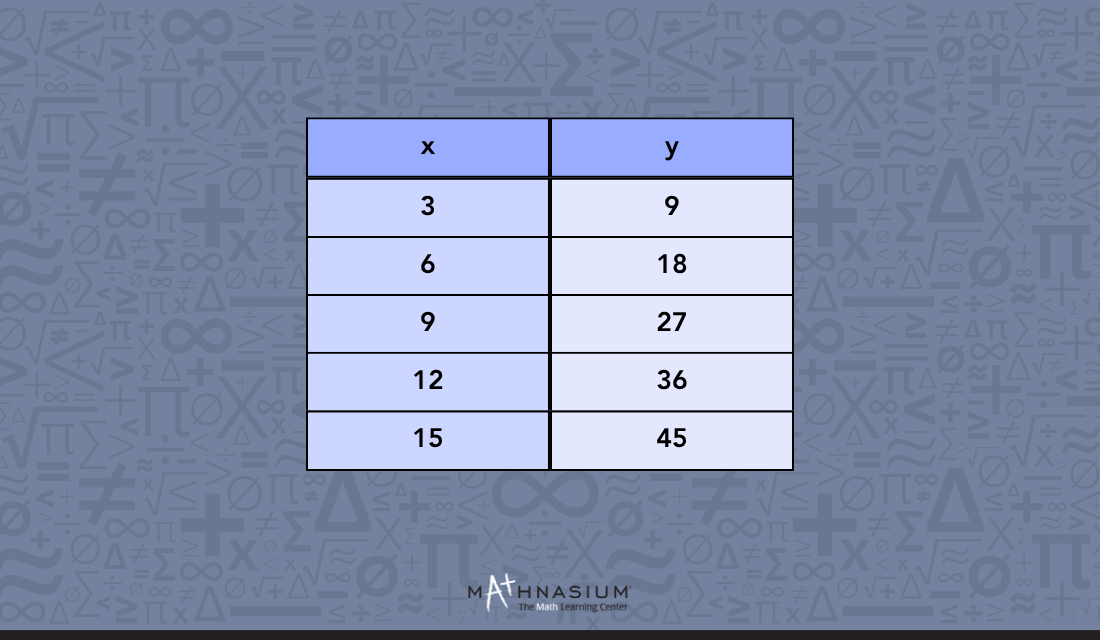
27 ÷ 3 = 9
Now every cell is filled in, and our table is complete!
📕 You May Also Like: Four Methods for Solving Proportions (and When to Use Each)
Practice: How Well Do You Know Ratio Tables?
Our tutors put together two tasks to test what you've learned today.
Task 1: Build a ratio table
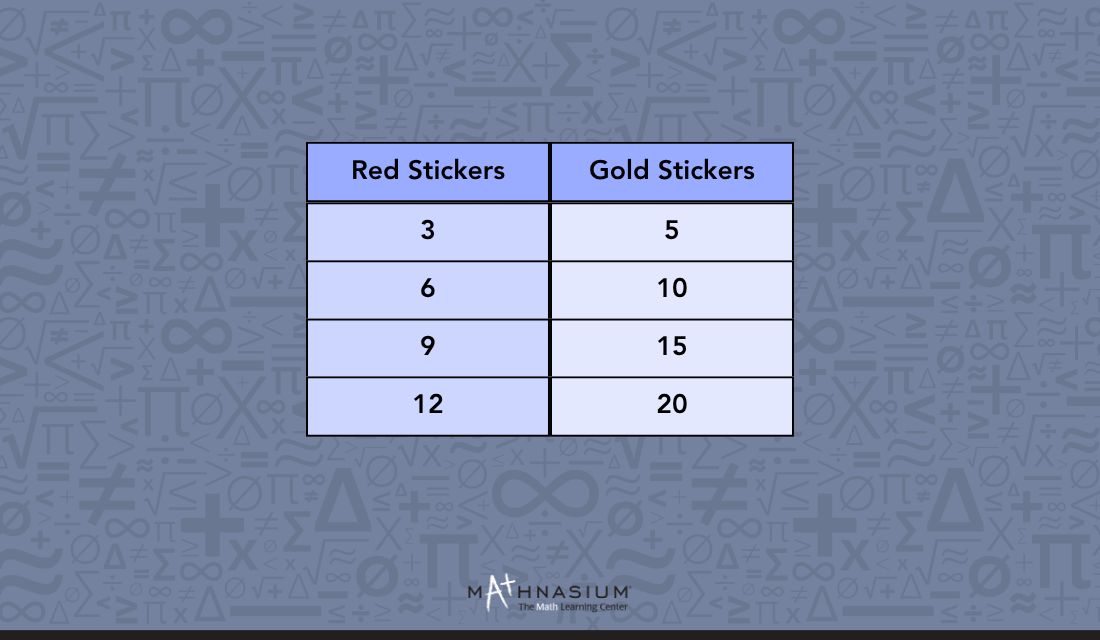
A craft box holds 9 red stickers for every 15 gold stickers.
Find the simplest form of this ratio, then build a ratio table with at least four rows.
Task 2: Solve a ratio table
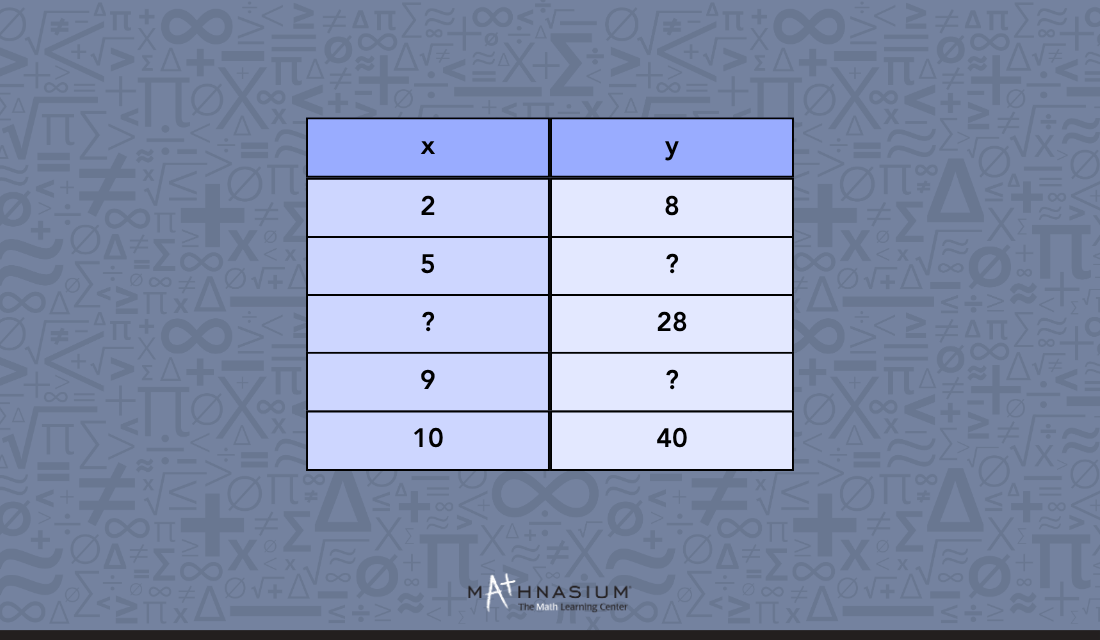
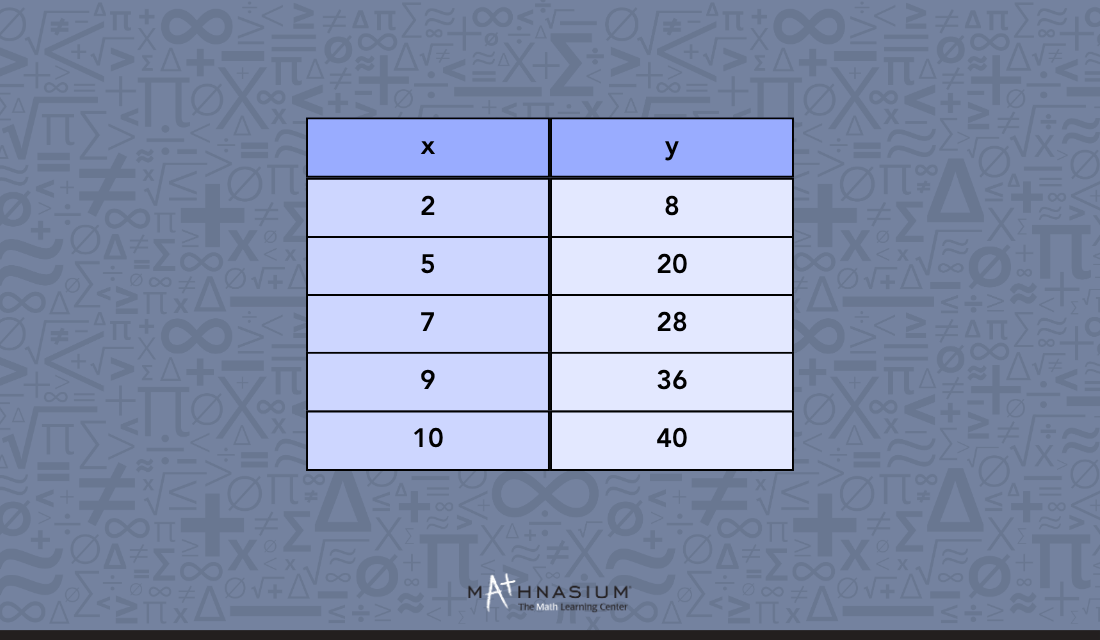
Take as much time as you need on each task. The answers are at the bottom of the guide.
 Mathnasium tutors use personalized learning plans and hands-on techniques to help students make sense of concepts like ratio tables and proportional thinking.
How Mathnasium Helps Students Master Ratios and Proportional Thinking
Mathnasium is a math-only learning center dedicated to helping K–12 students of all skill levels learn and master math.
By using ratio tables, students develop strong proportional thinking skills that naturally prepare them for higher-level math like algebra. Whether a student is just discovering these patterns or ready for advanced problem-solving, we meet them at their level.
Our proprietary teaching approach, the Mathnasium Method™, is what makes that possible.
Here's how it works.
Every student begins with a diagnostic assessment, a relaxed interaction that helps us pinpoint their strengths and knowledge gaps. With those insights, we build a personalized learning plan tailored to their needs and goals.
With the plan in place, our specially trained tutors follow it closely and deliver face-to-face instruction in a supportive and encouraging environment.
We use plain, everyday language and a mix of verbal, visual, mental, tactile, and written techniques so concepts land in a way that makes sense to each student.
When a student gets stuck, we break the concept down into manageable parts.
Then we explain both the how and the why behind each answer, so students build problem-solving skills and critical thinking they can use across math and beyond.
Our activities are often game-based and hands-on, and students earn rewards as they go. We celebrate every bit of progress, so confidence grows with each session.
Families see measurable results:
-
94% of parents report an improvement in their child's math skills and understanding
-
93% of parents report an improved attitude toward math after attending Mathnasium
-
90% of students saw an improvement in their school grades
With over 1,100 learning centers across North America, there is likely a Mathnasium close to you.
Families across Glen Mills, Concordville, Chadds Ford, and Thornton can visit Mathnasium of Glen Mills, a trusted local center with a proven record of building confident math thinkers.
Whether your student is looking to catch up, keep up, or get ahead in math, our local team is happy to help!
📅 Schedule a Free Diagnostic Assessment at Mathnasium of Glen Mills
Not near Glen Mills?
📍 Find a Mathnasium Learning Center Near You
Pssst! Check Your Answers Here
How did you do? Here are the answers:
Task 1: Build a ratio table
Task 2: Solve a ratio table


 (610) 358-5555
 (610) 358-5555