We call something “constant” when we know it doesn’t change. In math, that simple idea can tell us something important about how two quantities are connected.
When you’re in a car traveling at a constant speed of 60 miles per hour, no matter how long you stay on the road, you cover 60 miles for every hour you travel. We call that number the constant of proportionality.
You’ll come across proportional relationships like this in many math problems and everyday situations.
Today, we’ll dive deeper into the topic and explain what the constant of proportionality means, how to find it in tables, graphs, equations, and verbal descriptions, and where we use it in real life.

What Is the Constant of Proportionality in Plain Terms
The constant of proportionality is the fixed ratio between two quantities in a proportional relationship.
In other words, the quantities can change, but the ratio between them stays the same.
We usually write a proportional relationship as:
y = kx
Here:
-
x is the independent variable, or the quantity we start with or choose.
-
y is the dependent variable because its value changes in response to x.
-
k is the constant of proportionality that tells us how much y corresponds to each one unit of x.
Both x and y can change, but we want to find the one value that is the same as they change (k). To find it, we divide y by x to see how much of y goes with one unit of x:
k = \(\Large\frac{y}{x}\)
Now, let’s go back to our car example and see how this works with numbers.
If the car travels 120 miles in 2 hours, time is x because we choose how long the car travels. Distance is y because how far the car goes depends on that amount of time. To find how many miles correspond to 1 hour, we divide y by x, or the distance by the time:
k = y ÷ x = 120 ÷ 2 = 60
So, k = 60, which means the car travels 60 miles for every hour on the road.
As the travel time changes, the distance changes with it, from 60 miles in 1 hour to 180 miles in 3 hours, for example. Yet 180 miles ÷ 3 hours still gives us 60 miles per hour, just as 60 miles ÷ 1 hour does, which is why k remains constant.
📕 You May Also Like: 6 Ways to Help Your Middle Schooler Understand Proportionality
How to Recognize a Proportional Relationship
To recognize a proportional relationship, we can compare several pairs of values and check whether they all give us the same ratio.
Let’s start with a simple example:
|
x value
|
y value
|
Ratio (y ÷ x)
|
|
1
|
4
|
\(\Large\frac{4}{1}\) = 4
|
|
2
|
8
|
\(\Large\frac{8}{2}\) = 4
|
|
3
|
12
|
\(\Large\frac{12}{3}\) = 4
|
Even though x and y change from row to row, their ratio remains 4. We can therefore identify this as a proportional relationship with k = 4.
Now, let’s change one of the values and see what happens:
|
x value
|
y value
|
Ratio (y ÷ x)
|
|
1
|
4
|
\(\Large\frac{4}{1}\) = 4
|
|
2
|
9 |
\(\Large\frac{9}{2}\) = 4.5
|
|
3
|
12
|
\(\Large\frac{12}{3}\) = 4
|
Would you still call this relationship proportional?
We changed the y value in the second pair from 8 to 9, which changes the ratio from 4 to 4.5. Since the ratios are now 4, 4.5, and 4, they do not remain the same, so the relationship is not proportional.
We can also recognize proportional relationships on a graph. Their points form a straight line that passes through the origin (0, 0). The origin is important because when x = 0, y must also equal 0 in a proportional relationship.
If a straight line does not pass through the origin, it may represent a linear relationship, but it is not proportional.
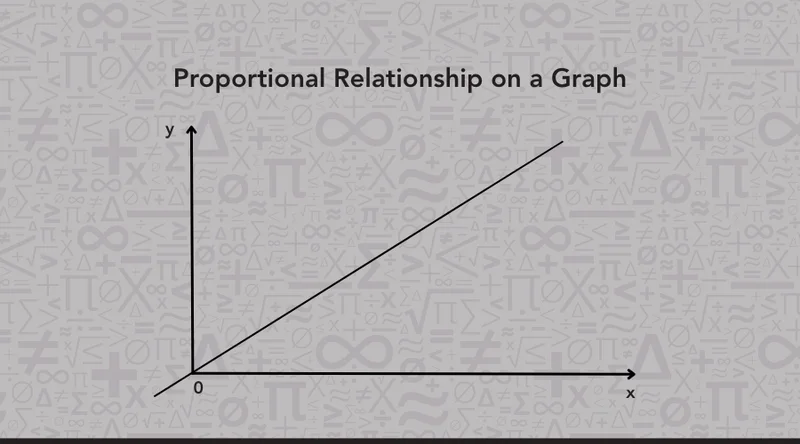
So, before we look for the constant of proportionality, we can check two things:
-
Do the corresponding values of y and x have the same ratio?
-
Does their graph form a straight line through (0, 0)?
If both are true, we are looking at a proportional relationship.
📕 You May Also Like: Four Methods for Solving Proportions (and When to Use Each)
How to Find the Constant of Proportionality
We can find the constant of proportionality from a table, graph, equation, or verbal description. The information may look different in each format, but we are still looking for the same fixed value, k.
To see how this works, we’ll use the same example throughout. Suppose you’re buying notebooks that cost $3 each, and we want to identify that $3-per-notebook rate as the constant of proportionality. Let’s see how we can do this across all four formats.
1. From a Table
We can find k in a table by looking at pairs of values that show how one quantity changes with another.
In our example, the number of notebooks is x because we can choose how many notebooks to buy. The total cost is y because it changes depending on the number of notebooks we choose.
Here’s how the total cost changes as we buy from 1 to 4 notebooks:
|
Notebooks, x
|
Total cost, y ($)
|
|
1
|
3
|
|
2
|
6
|
|
3
|
9
|
|
4
|
12
|
Each row pairs a number of notebooks with its total cost. 1 notebook corresponds to $3, 2 notebooks to $6, 3 notebooks to $9, and 4 notebooks to $12.
To find the constant of proportionality, we want to know how much y there is for one unit of x. Here, that means finding the cost for 1 notebook. We can choose any pair from the table and use our formula:
k = y ÷ x
If we choose 3 notebooks and $9, then x = 3 and y = 9. We divide the total cost by the number of notebooks:
k = 9 ÷ 3 = 3
So, k = 3, or $3 per notebook. We can check the other pairs in the table and see that the rate stays the same:
-
$3 ÷ 1 notebook = $3 per notebook
-
$6 ÷ 2 notebooks = $3 per notebook
-
$12 ÷ 4 notebooks = $3 per notebook
No matter which pair we use, we get $3 per notebook, so the constant of proportionality remains k = 3.
2. From a Graph
On a graph, the pairs from our table appear as points. The number of notebooks, x, goes on the horizontal axis, while the total cost, y, goes on the vertical axis.
So, our four pairs appear as (1, 3), (2, 6), (3, 9), and (4, 12). All four points lie on the same straight line through the origin (0, 0).
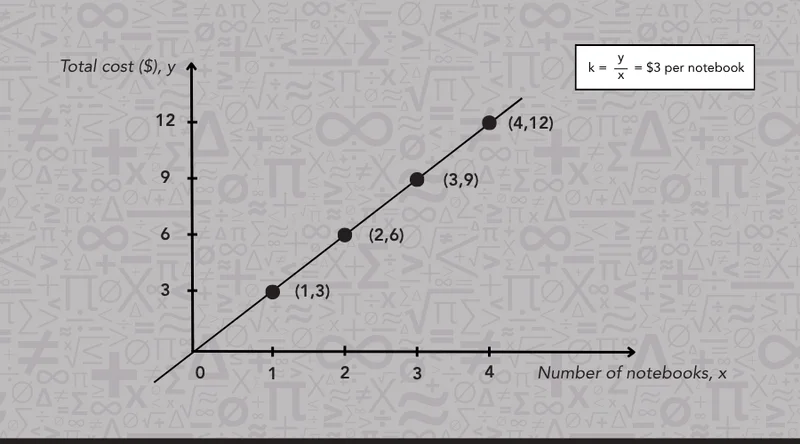
To find k from the graph, we can choose any point and read its coordinates. If we choose (2, 6), we have x = 2 and y = 6, which gives:
k = 6 ÷ 2 = 3
So, the graph shows the same constant of proportionality, k = 3, or $3 per notebook. On a proportional graph, k represents the rate of change, or slope, from the origin.
📕 You May Also Like: How the Coordinate Plane Works: A Guide for Parents And Students
3. From an Equation
When the relationship is given as an equation, we can find k by looking for the number that multiplies x. We write proportional relationships in the standard form y = kx.
Suppose our notebook relationship is given as y = 3x.
We can read this as “y equals 3 times x.” If we look at the standard form y = kx, we can see that 3 takes the place of k. Therefore, k = 3.
For our example, this means we multiply the number of notebooks, x, by 3 to get the total cost, y. With 1, 2, 3, and 4 notebooks, we get total costs of $3, $6, $9, and $12, so the equation represents the same $3-per-notebook rate we saw in the table and graph.
📕 You May Also Like: Expression vs. Equation Explained: A Student-Friendly Guide
4. From a Verbal Description
When a proportional relationship is described in words, we look for the rate that connects the two quantities. Sometimes that rate is stated directly.
For example, we can read: “Each notebook costs $3.”
The word “each” tells us the cost for one notebook, so the constant of proportionality is already given:
k = 3 dollars per notebook
Other descriptions may give us information for more than one unit. Let’s say 5 notebooks cost $15. To find the cost for 1 notebook, we divide the total cost by the number of notebooks:
k = 15 ÷ 5 = 3 dollars per notebook
In both descriptions, k = 3, or $3 per notebook.
Real-World Examples of the Constant of Proportionality
While the constant of proportionality may sound like a textbook term, it is just a rate we use all the time without thinking about it.
Let’s look at a few:
|
Situation
|
Example
|
Constant of Proportionality, k
|
|
Unit pricing
|
3 pounds of apples cost $6
|
$6 ÷ 3 = $2 per pound
|
|
Recipes
|
You need 4 cups of flour for 2 batches
|
4 ÷ 2 = 2 cups per batch
|
|
Earnings
|
You earn $45 for 3 hours of work
|
$45 ÷ 3 = $15 per hour
|
|
Printing
|
You print 90 pages in 3 minutes
|
90 ÷ 3 = 30 pages per minute
|
What can you notice about these examples?
Each calculation tells us how much of one quantity corresponds to one unit of another. We get $2 for one pound, 2 cups for one batch, $15 for one hour, and 30 pages for one minute. This unit rate is the constant of proportionality in each situation.
📕 You May Also Like: How Children Learn Real-World Math Before Anyone Teaches Them
FAQ About the Constant of Proportionality
You may still have a few more questions about the constant of proportionality, so we’ve gathered some common ones to answer.
1. When do students first learn about the constant of proportionality?
Students typically encounter the constant of proportionality in 7th grade math as part of ratios and proportional relationships. At this level, they learn to identify k from tables, graphs, equations, and verbal descriptions.
The concept continues into 8th grade and beyond as students work with linear equations, slope, and functions, where it helps build their understanding of rate of change.
2. Can the constant of proportionality be negative?
Yes. A constant of proportionality can be negative. For example, in y = -2x, we have k = -2. This means that for every increase of 1 in x, y decreases by 2. So, if x is 1, 2, and 3, the corresponding values of y are -2, -4, and -6.
3. What does a constant of proportionality of 1 mean?
When k = 1, the two quantities have the same numerical value because y = 1x, or simply y = x. For instance, if x is 2, 5, or 10, y is also 2, 5, or 10. In this case, there is 1 unit of y for every 1 unit of x. This follows directly from the standard y = kx relationship.
📕 You May Also Like: Below Zero: How Negative Numbers Describe the Real World

At Mathnasium, our tutors work hard to motivate, provide emotional support, and show students where math excellence can take them.
How Mathnasium Helps Students Master Proportional Thinking and Beyond
Mathnasium is a math-only learning center dedicated to helping K–12 students of all skill levels excel in math.
The constant of proportionality is one concept within the broader skill of proportional thinking, which builds on students’ foundational number sense and extends it into more advanced mathematical relationships.
This progression allows students to make connections between math concepts instead of treating each new skill as something separate.
No matter what your child is working toward, we support their progress through the Mathnasium Method™, our proprietary teaching approach, designed around each student's needs and learning style to help them learn and master math.
Our approach includes:
-
Assessment and Personalized Learning Plans: Each student begins their Mathnasium journey with a diagnostic assessment that identifies current skills, strengths, and knowledge gaps. From those findings, we build a personalized learning plan tailored to their goals.
-
Teaching for Understanding: Our specially trained tutors use natural language and a mix of verbal, visual, mental, tactile, and written techniques so each concept lands before we move forward. Different ways of presenting a concept give students more than one path to understanding, whether they benefit from visual tools, hands-on activities, or verbal explanations.
-
Problem-Solving and Critical Thinking: We give students time to work through problems independently. That productive struggle helps them learn to trust their own reasoning. When we do step in, we explain both the how and the why behind each answer, so students build problem-solving and critical thinking skills they can use in math and beyond. That balance between independence and guidance helps students stay engaged without feeling overwhelmed.
-
An Engaging and Fun Learning Environment: We use games and earned rewards to encourage students to participate actively and engage with math instead of simply listening to a lesson. They build confidence alongside fluency, and many develop a more positive relationship with math as they progress.
The impact extends beyond the classroom:
-
94% of parents report an improvement in their child's math skills and understanding
-
93% of parents report their child's improved attitude toward math after attending Mathnasium
-
90% of students saw an improvement in their school grades
With over 1,100 learning centers across North America, there is likely a Mathnasium close to you.
Whether your student is looking to catch up, keep up, or get ahead in math, your local Mathnasium center can help.
Start by booking a diagnostic assessment, and together we'll build a personalized plan for math mastery.



 (818) 285-8968