How does a fitness tracker know how many calories you burned after a 3-mile run? How does a video game calculate how many coins to award you when your character levels up to level 5? In both cases, we start with one value, follow a rule, and get another value as a result.
In math, we may describe this kind of relationship with a function. To see how a function works, we can use an input-output table, where we place the input in one column and the corresponding output in another.
Today, we’ll look at how input-output tables work and how we can find the rule connecting the inputs and outputs.

Quick Review: What Is a Function?
A function is a rule that connects one value we start with, called the input, to one result, called the output. We usually write the input as x and the output as y.
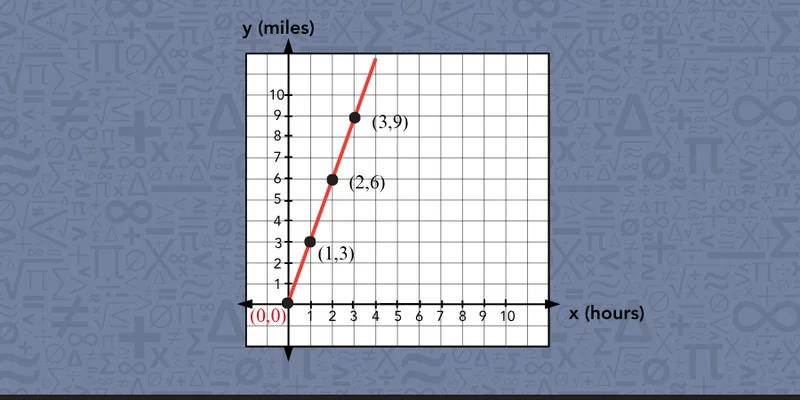
Imagine you ride a bike at a constant speed of 3 miles per hour. The number of hours you ride is the input, and the total distance you travel is the output.
y = 3x
Here, x represents time in hours, and y represents distance in miles. To find the output, we multiply the input by 3.
For example:
-
If x = 1, then y = 3 × 1 = 3.
-
If x = 2, then y = 3 × 2 = 6.
-
If x = 3, then y = 3 × 3 = 9.
This relationship is a function because each input gives us one specific output. If we ride for 2 hours at the same constant speed, the rule always gives us 6 miles. The input 2 cannot match both 6 miles and, say, 8 miles at the same time under this rule.
We can also show this function on a graph.
-
Set up the axes: We place time, the input, on the x-axis, and distance, the output, on the y-axis.
-
Turn each input-output pair into an ordered pair: One hour and 3 miles becomes (1, 3), 2 hours and 6 miles becomes (2, 6), and 3 hours and 9 miles becomes (3, 9).
-
Plot each point: For (1, 3), we move to 1 on the x-axis and then up to 3 on the y-axis. We repeat the same process for (2, 6) and (3, 9).
-
Connect the points: Every extra hour adds 3 miles, so the graph forms a straight line.
For this situation, we only use the part of the graph where x and y are positive because we cannot ride for a negative amount of time, and the distance traveled also cannot be negative.
Another way we can organize the same input and output values is with an input-output table.

What Is an Input-Output Table and How Does It Connect to a Function?
An input-output table shows how each input value is matched with an output value according to a rule. We can use the table to look for patterns and understand how the two quantities are related.
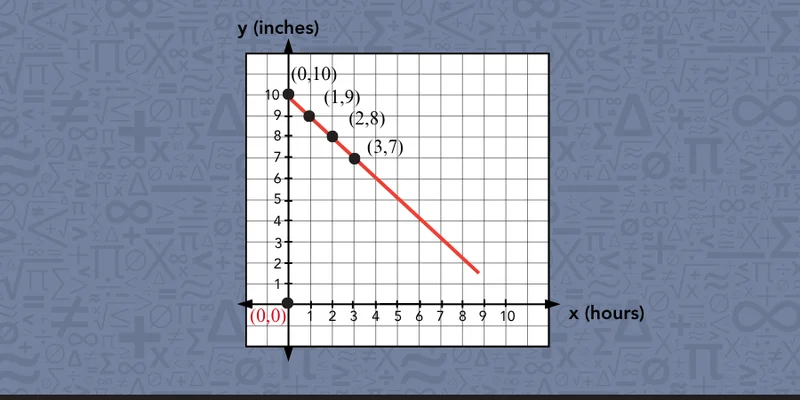
Think of a candle that is 10 inches tall and burns down 1 inch every hour. Here is what an input-output table might look like for this relationship:
|
Input (hours)
|
Output (candle height in inches)
|
|
0
|
10
|
|
1
|
9
|
|
2
|
8
|
|
3
|
7
|
Here, the input tells us how many hours have passed, and the output tells us the candle’s height at that time. We can see that each time the input increases by 1, the output decreases by 1. In other words, the candle’s height is 10 inches minus the number of hours that have passed.
This relationship gives us the function y = 10 - x, where x is the number of hours and y is the candle’s height. Each row shows one input-output pair:
-
After 1 hour, the candle is 9 inches tall.
-
After 2 hours, it is 8 inches tall, and so on.
Let’s connect this table to a graph.
Every row gives us an ordered pair we can plot: (0, 10), (1, 9), (2, 8), and (3, 7). If we plot these points, we can see the same relationship represented visually. Because the candle burns at a steady rate, the points lie along the straight line described by the function’s rule.
Our graph will stay in the nonnegative part of the coordinate plane because neither value can go below zero. We cannot have negative time, and the candle cannot have a negative amount remaining.
But what if we’re given a table and don’t know which function it represents, or, in other words, which rule connects the inputs and outputs? Let’s find out!
📕 You May Also Like: Functions vs. Equations: What Is the Difference?
How to Find the Rule an Input-Output Table Follows
To find the rule that an input-output table represents, we can work through these steps:
-
Compare each input with its output.
-
Look for operations and rule types that fit the table.
-
Use the first input-output pair to complete or check the possible rule.
-
Check it against the remaining pairs.
-
Graph the relationship if it helps us see the pattern more clearly.
At Mathnasium, we like explaining math concepts through examples, so we’ll take this table through the steps to find the rule it follows.
Step 1: Compare each input with its output
We start by comparing each input with its matching output.
For the pairs 1 → 3, 2 → 5, 3 → 7, and 4 → 9 we can notice that:
-
The output is always larger than the input.
-
The output is always a little more than twice the input.
-
Doubling the input gets us close, but it does not quite give us the output. For example, 2 × 1 = 2 , but the output for an input of 1 is 3 in our table.
Step 2: Look for operations and rule types that fit the table
Now we can use what we noticed in Step 1 to start building a possible rule. Instead of guessing at random, we can match the pattern in the table with a few common types of rules.
Rule-Finding Clues
During sessions, we notice that students may get stuck trying to guess the operation that connects the input with the output on their own. So, our tutors put together this table to help you narrow down what kind of rule may be at work:
|
What you may notice
|
What you might try
|
|
The output is always the same fixed amount greater than the input.
|
Add a constant: y = x + b.
|
|
The output is always the same fixed amount less than the input.
|
Subtract a constant: y = x − b.
|
|
The output is always the same whole-number multiple of the input.
|
Multiply by a constant: y = mx.
|
|
The output is a multiple of the input, plus or minus the same extra amount.
|
Try a linear rule such as y = mx + b.
|
|
The pattern involves squares, or the amount of change does not stay constant.
|
Try a nonlinear rule such as y = x².
|
In our table, when we multiply the input by 2, we almost get to the output each time. We are always short by 1, so we can try a linear rule that doubles the input and then adds a constant.
Step 3: Use the first input-output pair to complete or check the rule
Since doubling the input gets us close to each output, we can start with:
y = 2x + b
In some cases, we can test a possible rule right away with the first input-output pair. In our example, we will use that pair to find the missing constant b. To do that, we substitute the first input-output pair, x = 1 and y = 3, into the equation:
3 = 2 × 1 + b
3 = 2 + b
3 - 2 = 2 - 2 + b
b = 1
So, the value of b is 1. That gives us a possible rule:
y = 2x + 1
Now that the rule is complete, we can test it against the other pairs in the table.
Step 4: Check the possible rule with the remaining pairs
One matching pair isn’t enough to confirm a rule, so we need to test it with the remaining pairs in the table. We substitute each input and output into our possible rule and check whether the equation stays true:
|
x
|
y
|
Possible rule: y = 2x + 1
|
Match?
|
|
2
|
5
|
2 × 2 + 1 = 5
|
Yes.
|
|
3
|
7
|
2 ×3 + 1 = 7
|
Yes.
|
|
4
|
9
|
2 × 4 + 1 = 9
|
Yes.
|
Every pair works with the rule, so we can confirm that y = 2x + 1 connects the inputs and outputs in this table.
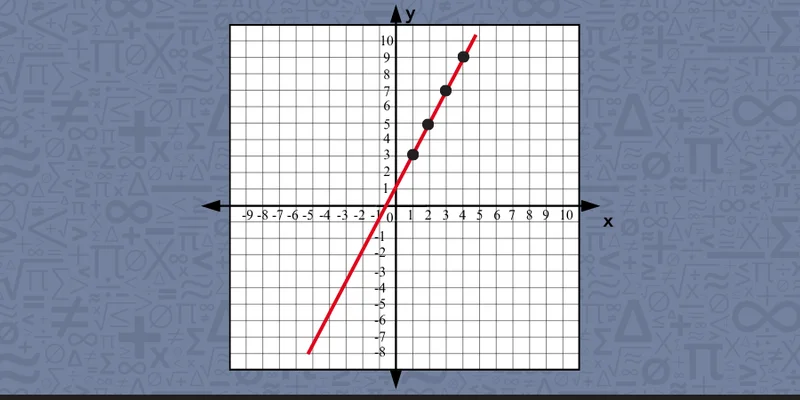
Step 5: Graph the rule if needed
We may also graph the rule to see the relationship we found in a visual form, although this step is optional.
-
Use each row of the table to form an ordered pair. The input becomes the first number, and the output becomes the second: (1, 3), (2, 5), (3, 7), and (4, 9).
-
Plot each pair on the coordinate plane, taking the input as the x-coordinate and the output as the y-coordinate.
-
Connect the points to see the shape of the graph. Here, they form a straight line, which matches the linear rule we found, y = 2x +1.
📕 You May Also Like: How to Read 4 Most Common Graphs - A Kid-Friendly Guide
Your Turn: Which Rule Does This Table Represent?
Try to find the rule for this input-output table on your own. You can check your answer at the bottom of the page.
📕 You May Also Like: Why Math Practice Matters & What Happens When Kids Skip It

Mathnasium tutors guide students through problems rather than simply giving correct answers, helping them build true understanding of math concepts.
How Mathnasium Helps Students With Functions (and Any Other Math Topic)
Mathnasium is a math-only learning center dedicated to helping K–12 students of all skill levels excel in math.
We guide students toward true math mastery of any math skill or concept, which means understanding the idea behind a procedure and being able to apply it in future math.
To do that, we use the Mathnasium Method™, our proprietary teaching approach, designed around individual learning needs and styles.
Here’s how it unfolds.
Each student begins with a diagnostic assessment that helps us understand their current skill level, knowledge gaps, goals, and how they think and feel about math. For topics like input-output tables and functions, this may include looking at how comfortably they recognize patterns and connect numerical relationships to rules.
Using these insights, we build a personalized learning plan focused on the skills the student needs most, whether that means identifying patterns in tables, finding and testing function rules, connecting tables to equations and graphs, or preparing for more advanced algebra.
Our specially trained tutors follow that plan closely and provide live, face-to-face instruction in a caring and fun group environment. They use mental, verbal, visual, tactile, and written techniques to help students compare inputs and outputs, notice structure, test possible rules, and explain why a relationship works.
Students also get room to think through problems before tutors step in. Our tutors encourage them to test their own ideas and explain their reasoning. This helps students build critical thinking, problem-solving skills, and greater independence as they move into more complex math.
Fun is part of the approach, too. We use game-based activities, rewards, and consistent encouragement to keep students engaged as they spot patterns, test ideas, and work through new relationships.
The results speak for themselves:
-
94% of parents report an improvement in their child's math skills and understanding
-
93% of parents report their child's improved attitude toward math after attending Mathnasium
-
90% of students saw an improvement in their school grades
With over 1,100 learning centers across North America, there is likely a Mathnasium close to you.
For families in and near Meridian, Idaho, Mathnasium of Meridian brings that same approach close to home, with specially trained tutors who help students make sense of patterns, input-output relationships, and the function concepts that build from them.
If your child finds function rules or any other math concept hard, a free diagnostic assessment is a great place to start. Using what we learn, we create a personalized learning plan focused on the skills they need next.
📅 Schedule a Free Assessment at Mathnasium of Meridian
Not near Meridian?
📍 Find a Mathnasium Learning Center Near You
Pssst…! Check Your Answers Here
Ready to see how you did? Here is the answer to the practice problem above:
The rule is:
y = 3x + 1.
1. Compare each input with its output. Look at how the values are related and how the outputs change as the inputs change.
2. Look for a rule type that fits the pattern. Here, each increase of 1 in the input goes with an increase of 3 in the output. That points us toward a linear rule of the form y = mx + b, with m = 3.
3. Build a possible rule and test it on the first pair. We use x = 1 and y = 4 to find:
4 = 3 × 1 + b
4 = 3 + b
b = 1
So our possible rule is y = 3x + 1.
4. Check the rule with the remaining pairs. We test the other inputs:
3 × 2 + 1 = 7
3 × 3 + 1 = 10
3 × 4 + 1 = 13
Every pair matches, so y = 3x + 1 is the correct rule.


 (208) 888-0020
 (208) 888-0020